Exam 1: Looking at Datadistributions
Exam 1: Looking at Datadistributions127 Questions
Exam 2: Looking at Datarelationships48 Questions
Exam 3: Producing Data70 Questions
Exam 4: Probability: the Study of Randomness93 Questions
Exam 5: Sampling Distributions77 Questions
Exam 6: Introduction to Inference89 Questions
Exam 7: Inference for Means103 Questions
Exam 8: Inference for Proportions101 Questions
Exam 9: Inference for Categorical Data122 Questions
Exam 10: Inference for Regression91 Questions
Exam 11: Multiple Regression95 Questions
Exam 12: One-Way Analysis of Variance74 Questions
Exam 13: Two-Way Analysis of Variance53 Questions
Exam 14: Logistic Regression53 Questions
Exam 15: Nonparametric Tests57 Questions
Exam 16: Bootstrap Methods and Permutation Tests42 Questions
Exam 17: Statistics for Quality: Control and Capability86 Questions
Select questions type
Malaria is a leading cause of infectious disease and death worldwide.The table below represents the mean number of reported malaria cases (between 1996 and 2006)for each of 10 West African countries,as published in the journal Statistica Neerlandica in 2010. 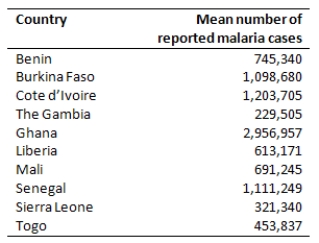 Why is it not appropriate to use a histogram to display these data?
(Multiple Choice)
4.7/5  (41)
(41)
The World Malaria Report (2008)has information on the number of reported malaria cases from 2005 and 2006 for the 10 countries listed in West Africa.The data are presented in the table below. 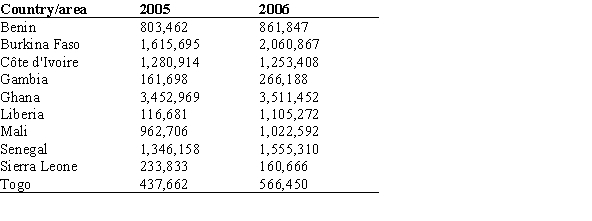 The mean of the reported West African malaria cases in 2006 is ___________.
(Multiple Choice)
4.8/5 (36)
The bar graph below represents the highest education level achieved for 30 random females and 60 random males questioned on a street in downtown Washington,DC. 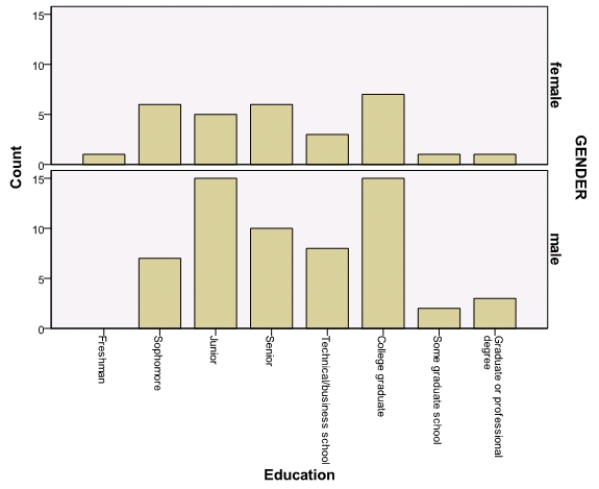 More men than women are college graduates.
(True/False)
4.9/5 (33)
A nationwide study was done to assess the programming proficiency of students taking a statistical programming class.The students were asked their proficiency in the statistical software SAS.The survey was sent to students at over 100 universities and 112 responses were received from 21 different universities.The results were published in the journal International Mathematical Forum in 2011.The results in the form of a pie chart are shown below. 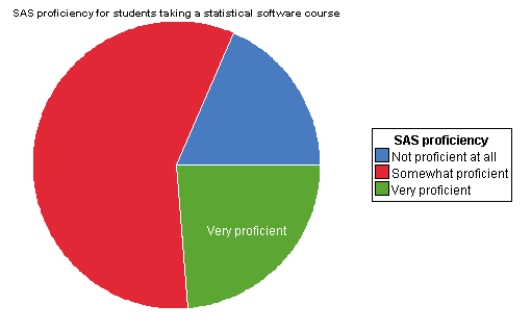 From the pie chart,we can see that most students are _____.
(Multiple Choice)
4.8/5 (44)
The histogram below shows data from 30 students who were asked,"How much time do you spend on the Internet in minutes?" What are some features about the data? 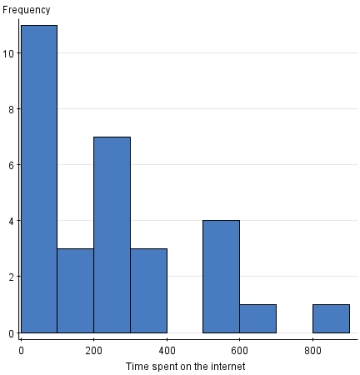
(Multiple Choice)
4.9/5 (34)
The asking prices (in thousands of dollars)for a sample of 13 houses currently on the market in Neighborville are listed below.For convenience,the data have been ordered.  What is the five-number summary?
(Multiple Choice)
4.9/5 (33)
During the early part of the 1994 baseball season,many sports fans and baseball players noticed that the number of home runs being hit seemed to be unusually large.Below are separate stemplots for the number of home runs by American League and National League teams based on the team-by-team statistics on home runs hit through Friday,June 3,1994 (from the Columbus Dispatch,Sunday,June 5,1994). 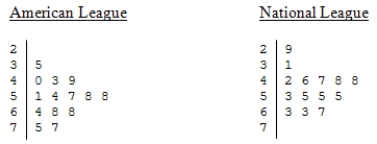 Legend: 2|9 represents 29. What is the median for the number of home runs for the American League teams?
(Multiple Choice)
4.8/5 (38)
According to the American Cancer Society,the decline in colorectal cancer mortality,primarily attributed to early detection and treatment,has not been consistent among race/ethnic groups.A colorectal exam is one method for early detection of colorectal cancer.In 2008,29.5% of whites,56.9% of African Americans,and 62.4% of Hispanics had not received a colorectal exam within the last 10 years.What is the best method to display these data?
(Multiple Choice)
4.9/5 (39)
On the first day of class,statistics professors ask each student to fill out a demographic questionnaire to learn information about their class.Which of the following variables is/are categorical?
(Multiple Choice)
4.8/5 (31)
Suppose you own a pizza delivery company and you are trying to determine the best campus on which to sell pizza.What would be the best measurement to make the comparison?
(Multiple Choice)
4.9/5 (37)
A study of 2007 model automobiles was conducted.In the study the following variables were considered: the Region in which the car was manufactured (Europe,North America,Asia);the Type of automobile (compact,midsize,large);the fuel economy in city driving of the automobile (MPG-City);volume of the engine in liters (EngSize);and the type of Fuel used (regular,premium,diesel).The variables Region,Type,MPG-City,EngSize,and Fuel are,respectively,
(Multiple Choice)
4.9/5 (46)
The appearance of a histogram will change when you _______.
(Multiple Choice)
4.8/5 (38)
A distributor of electronics is doing a customer satisfaction survey for a manufacturer of tablet computers.A sample of 68 clients is asked to rate a particular tablet on appearance,functionality,ease of use,and price on a scale of 1 to 10,where 1 corresponds to the worst rating and 10 to the best possible rating.A bar graph of the ease of use ratings classified by gender is given below. 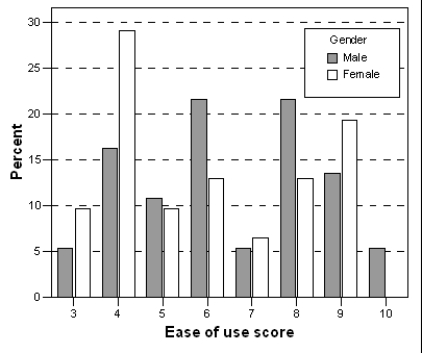 What percentage of the sampled female clients rated the tablet as not so easy to use (a rating of 4 or lower)?
(Multiple Choice)
4.8/5 (38)
Below is a data set with information on students in a basic statistics class at a local university.What is a key characteristic of the data set? 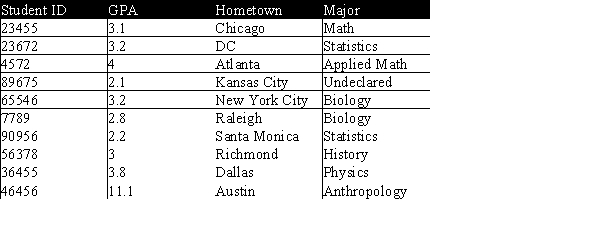
(Multiple Choice)
4.8/5 (39)
The salaries paid to the eight employees of a small market research company are as follows: the five telephone interviewers are each paid $32,000;two administrative assistants are paid $48,000;a supervisor is paid $60,000;and the senior manager is paid $190,000.The number of employees earning more than the mean salary is
(Multiple Choice)
4.8/5 (33)
The standard deviation s is a useful measure of a characteristic of a distribution of data values.Which of the following statements about s is FALSE?
(Multiple Choice)
4.7/5 (36)
What method is useful when comparing two distributions using a stemplot?
(Multiple Choice)
4.8/5 (32)
The Environmental Protection Agency records data on the fuel economy of many different makes of cars.Data on the mileage of 20 randomly selected cars are listed below.The values are ordered for convenience.  What is the median mileage for these 20 cars?
(Multiple Choice)
4.9/5 (45)
Filters
- Essay(0)
- Multiple Choice(0)
- Short Answer(0)
- True False(0)
- Matching(0)