Exam 1: Looking at Datadistributions
Exam 1: Looking at Datadistributions127 Questions
Exam 2: Looking at Datarelationships48 Questions
Exam 3: Producing Data70 Questions
Exam 4: Probability: the Study of Randomness93 Questions
Exam 5: Sampling Distributions77 Questions
Exam 6: Introduction to Inference89 Questions
Exam 7: Inference for Means103 Questions
Exam 8: Inference for Proportions101 Questions
Exam 9: Inference for Categorical Data122 Questions
Exam 10: Inference for Regression91 Questions
Exam 11: Multiple Regression95 Questions
Exam 12: One-Way Analysis of Variance74 Questions
Exam 13: Two-Way Analysis of Variance53 Questions
Exam 14: Logistic Regression53 Questions
Exam 15: Nonparametric Tests57 Questions
Exam 16: Bootstrap Methods and Permutation Tests42 Questions
Exam 17: Statistics for Quality: Control and Capability86 Questions
Select questions type
Statistics were gathered on the number of homicides committed with guns in Australia in the years from 1980 to 2004.From these data the following graph was constructed. 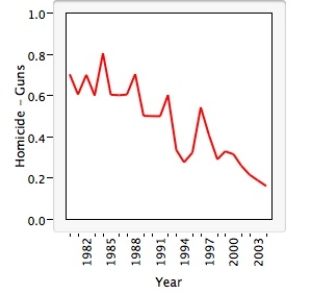 This plot is a graph of a(n)_____________,and it shows that there is/are ___________ in the data.
(Multiple Choice)
4.9/5  (37)
(37)
A study is being conducted on air quality at a small college in the South.As part of this study,monitors were posted at every entrance to this college from 6:00 a.m.to 10:00 p.m.on a randomly chosen day.The monitors recorded the mode of transportation used by each person as they entered the campus.Based on the information recorded,the following bar graph was constructed. 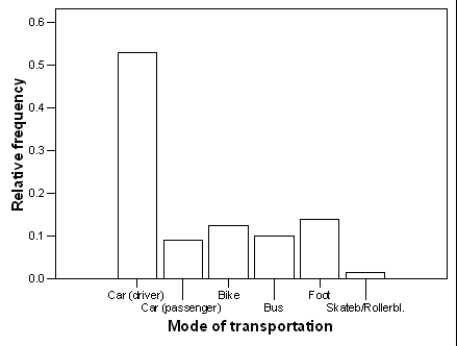 If 1200 people entered campus on this particular day, (approximately)how many people arrived by bus?
(Multiple Choice)
4.9/5 (43)
When making a stemplot,it is appropriate to _______ if the values cover a very small range.
(Multiple Choice)
4.8/5 (31)
Consider the following data which describe the amount of time in minutes students spend studying for a quiz: 10,11,11,12,12,14,15,18,19,20,22,24,39,40,41,44,46,50,52,52,53,55,70.
What numbers make up the leaf of the first stem if you were splitting the stems?
(Multiple Choice)
4.8/5 (30)
A consumer group surveyed the prices for cotton,extra-long twin bed sheet sets in five different department stores and reported the average price as $16.We visited four of the five stores and found the prices to be $12,$15,$17,and $22.Assuming that the consumer group is correct,what is the price of the item at the store that we did not visit?
(Multiple Choice)
4.8/5 (32)
Variables that take numeric values for which arithmetic operations make sense are called _______.
(Multiple Choice)
4.9/5 (39)
Malaria is a leading cause of infectious disease and death worldwide.The table below represents the mean number of reported malaria cases (between 1996 and 2006)for each of 10 West African countries,as published in the journal Statistica Neerlandica in 2010. 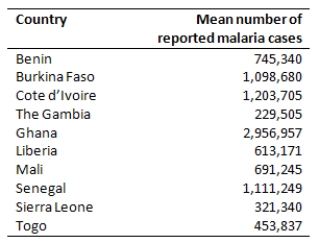 True or False.The variable "country" is a quantitative variable.
(True/False)
4.8/5 (41)
The World Malaria Report (2008)has information on the number of reported malaria cases from 2005 and 2006 for the 10 countries listed in West Africa.The data are presented in the table below.  The median of the reported malaria cases in 2005 is _________.
(Multiple Choice)
4.9/5 (34)
The Environmental Protection Agency records data on the fuel economy of many different makes of cars.Data on the mileage of 20 randomly selected cars are listed below.The values are ordered for convenience.  What is the interquartile range for the mileage data?
(Multiple Choice)
4.8/5 (40)
The Consumers Union measured the gas mileage in miles per gallon of 38 automobiles from the 1978-1979 model-year on a special test track.The pie chart below provides information about the country of manufacture of the automobiles used in this study by the Consumers Union. 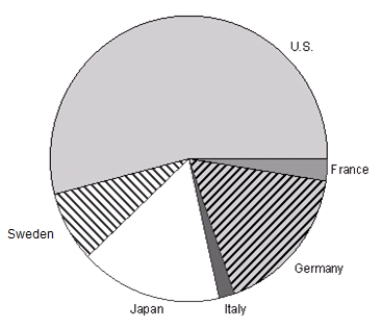 Which of the following bar graphs represents the same data as in the pie chart?
(Multiple Choice)
4.8/5 (37)
When using a pie chart,the sum of all the percentages should be _____.
(Multiple Choice)
4.7/5 (36)
The World Malaria Report (2008)has information on the number of reported malaria cases from 2005 and 2006 for the 10 countries listed in West Africa.The data are presented in the table below. 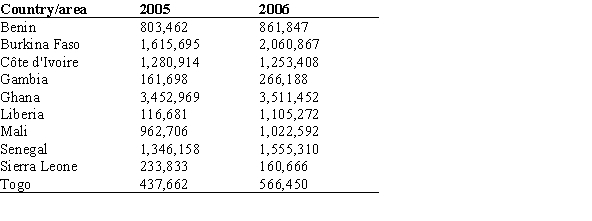 The mean of the reported West African malaria cases in 2005 is ___________.
(Multiple Choice)
4.9/5 (41)
The histogram below shows data from 30 students who were asked,"How much time do you spend on the Internet in minutes?" How could you improve the histogram to better display the distribution? 
(Multiple Choice)
4.9/5 (27)
The following data are the magnitudes of earthquakes around the world recorded on January 13,2008.  Because of equipment problems,two earthquakes were unrecorded,although it was known that both had a value less than 2.7.The median magnitude of earthquakes on this date is
(Multiple Choice)
4.9/5 (42)
The first day of class the professor collects information on each student to make a data set that will be analyzed throughout the semester.The information asked includes hometown,GPA,number of classes,number of siblings,and favorite subject.What are the cases in this data set?
(Multiple Choice)
4.7/5 (36)
When using a histogram to display categorical values,you should make sure the categories are in alphabetical order.
(Multiple Choice)
4.7/5 (33)
A set of midterm exam scores has a median that is much larger than the mean.Which of the following statements is most consistent with this information?
(Multiple Choice)
4.8/5 (36)
A nationwide study was done to assess the programming proficiency of students taking a statistical programming class.The students were asked their proficiency in the statistical software SAS.The survey was sent to students at over 100 universities and 112 responses were received from 21 different universities.The results were published in the journal International Mathematical Forum in 2011.The results in the form of a pie chart are shown below. 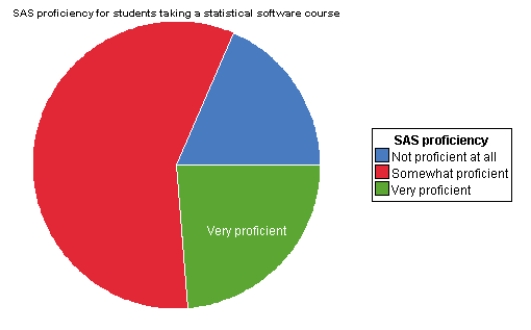 True or False.A bar graph would give the same information?
(True/False)
4.9/5 (34)
We have a data set where the cases are college students.One of the variables in the data set is "hometown." What type of variable is hometown?
(Multiple Choice)
4.9/5 (38)
The Insurance Institute for Highway Safety publishes data on the total damage suffered by compact automobiles in a series of controlled,low-speed collisions.The cost for a sample of nine cars,in hundreds of dollars,is provided below
 What is the mean of the total damage suffered for this sample of cars?
(Multiple Choice)
4.8/5 (35)
Filters
- Essay(0)
- Multiple Choice(0)
- Short Answer(0)
- True False(0)
- Matching(0)