Exam 12: B: linear Regression and Correlation
Exam 1: Describing Data With Graphs134 Questions
Exam 2: Describing Data With Numerical Measures235 Questions
Exam 3: Describing Bivariate Data57 Questions
Exam 4: A: probability and Probability Distributions107 Questions
Exam 4: B: probability and Probability Distributions157 Questions
Exam 5: Several Useful Discrete Distributions166 Questions
Exam 6: The Normal Probability Distribution235 Questions
Exam 7: Sampling Distributions231 Questions
Exam 8: Large-Sample Estimation187 Questions
Exam 9: A: large-Sample Tests of Hypotheses154 Questions
Exam 9: B: large-Sample Tests of Hypotheses106 Questions
Exam 10: A: Inference From Small Samples192 Questions
Exam 10: B: Inference From Small Samples124 Questions
Exam 11: A: The Analysis of Variance136 Questions
Exam 11: B: The Analysis of Variance137 Questions
Exam 12: A: linear Regression and Correlation131 Questions
Exam 12: B: linear Regression and Correlation171 Questions
Exam 13: Multiple Regression Analysis232 Questions
Exam 14: Analysis of Categorical Data158 Questions
Exam 15: A:nonparametric Statistics139 Questions
Exam 15: B:nonparametric Statistics95 Questions
Select questions type
Circumference and Age Narrative
Evidence supports using a simple linear regression model to estimate the circumference of a pine tree based on its age. Let x be the age of the pine tree (measured in years) and y be the circumference (measured in cm). A random sample of 11 mature pine trees was selected and the following data recorded:  The following output was generated using statistical software:
 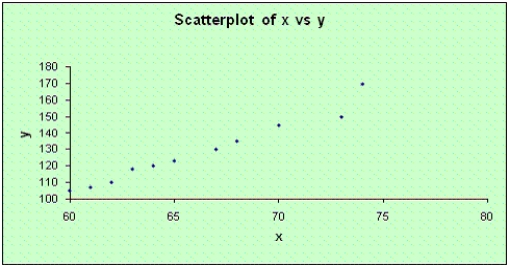 Regression Analysis
The regression equation is
y = -148 + 4.18x
Regression Analysis
The regression equation is
y = -148 + 4.18x  S = 4.025 R-Sq = 96.4% R-Sq(adj) = 96.0%
Analysis of Variance Table
S = 4.025 R-Sq = 96.4% R-Sq(adj) = 96.0%
Analysis of Variance Table  Unusual Observations
  R denotes an observation with a large standardized residual
-Refer to Circumference and Age Narrative. Based on the plots in the previous two questions, should you use the model in the computer printout to predict circumference? Justify your answer.
R denotes an observation with a large standardized residual
-Refer to Circumference and Age Narrative. Based on the plots in the previous two questions, should you use the model in the computer printout to predict circumference? Justify your answer.
(Essay)
4.9/5  (26)
(26)
Amount of Trees and Beavers
A scientist is studying the relationship between x = density (in number per square metre) of aspen trees around a pond and y = beaver abundance. The following statistical software output is from a regression analysis for predicting y from x.  s = 0.4839 R-sq = 97.0% R-sq(adj) = 96.5%
Analysis of Variance
s = 0.4839 R-sq = 97.0% R-sq(adj) = 96.5%
Analysis of Variance  -Refer to Amount of Trees and Beavers. What is the percentage of variation in beaver abundance accounted for by regression on the density of aspen trees?
NAR: Amount of Trees and Beavers
-Refer to Amount of Trees and Beavers. What is the percentage of variation in beaver abundance accounted for by regression on the density of aspen trees?
NAR: Amount of Trees and Beavers
(Essay)
4.8/5 (33)
Income and Height Narrative
Do tall men earn more than short ones? An economist collected the data shown below for 25 men, where the annual income (y) in thousands of dollars and the height of the income earner (x) in cm. 
 -Refer to Income and Height Narrative. Calculate the coefficient of determination
  What information does this value give about the usefulness of the linear regression model?
(Essay)
4.8/5 (42)
Extra Help Sessions Narrative
A study was conducted to determine the effect of extra help sessions attended on students' ability to avoid mistakes on a 20-question test. The data shown below represent the number of extra help sessions attended (x) and the average number of mistakes (y) recorded.  -Refer to Extra Help Sessions Narrative. Plot the six points and graph the line. Does the line appear to provide a good fit to the data points?
(Essay)
4.9/5 (42)
Amount of Trees and Beavers
A scientist is studying the relationship between x = density (in number per square metre) of aspen trees around a pond and y = beaver abundance. The following statistical software output is from a regression analysis for predicting y from x. s = 0.4839 R-sq = 97.0% R-sq(adj) = 96.5%
Analysis of Variance
-Refer to Amount of Trees and Beavers. What is the least-squares regression equation?
(Essay)
4.8/5 (24)
Soft Drink Sales Narrative
A soft drink vendor, set up near a beach for the summer, was interested in examining the relationship between sales of soft drinks (in litres per day) and maximum temperature of the day. The vendor records the following data for a random sample of eight days in the summer, where y = number of litres of soft drinks sold per day and x = maximum temperature, in degrees Celsius, recorded for the day:  The following summary information was computed:
 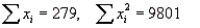 In addition, the following partial output was generated using statistical software:
The regression equation is sales = -28.460 + 1.7372 temp, MSE = 0.496767
-Refer to Soft Drink Sales Narrative. Find a 95% confidence interval for the mean value of y (sales) when the maximum temperature is
In addition, the following partial output was generated using statistical software:
The regression equation is sales = -28.460 + 1.7372 temp, MSE = 0.496767
-Refer to Soft Drink Sales Narrative. Find a 95% confidence interval for the mean value of y (sales) when the maximum temperature is  C.
C.
(Essay)
4.8/5 (28)
Advertising and Money Spent Narrative
A marketing analyst is studying the relationship between x = money spent on television advertising and y = increase in sales. One study reported the following data (in dollars) for a particular company.  -Refer to Advertising and Money Spent Narrative. Calculate
  and SSE for these data.
(Essay)
4.9/5 (39)
Sleep Deprivation Narrative
A study was conducted to determine the effects of sleep deprivation on people's ability to solve s. The amount of sleep deprivation varied with 8, 12, 16, 20, and 24 hours without sleep. A total of ten subjects participated in the study, two at each sleep deprivation level. After his or her specified sleep deprivation period, each subject was administered a set of simple addition s, and the number of errors was recorded. These results were obtained:  -Refer to Sleep Deprivation Narrative. What is the best estimate of the common population variance
  ?
?
(Essay)
4.9/5 (36)
TV Game Show Revenues Narrative
An ardent fan of television game shows has observed that, in general, the more educated the contestant, the less money he or she wins. To test her belief, she gathers data about the last eight winners of her favourite game show. She records their winnings in dollars and the number of years of education. The results are as follows.  -Refer to TV Game Show Revenues Narrative. Predict with 95% confidence the winnings of a contestant who has 15 years of education.
(Essay)
4.8/5 (30)
Delivery Time Narrative
Let x be the number of pieces of furniture in a delivery truck and y be the time (in hours) it takes the delivery person to deliver all the pieces of furniture. A simple linear regression analysis related x and y where the least-squares estimates of the regression parameters are a = 1.85 and b = 0.55.
-Refer to Delivery Time Narrative. Use the least-squares regression line to estimate the time it takes to deliver ten pieces of furniture. (You may assume that ten is in the range of the data.)
(Essay)
4.9/5 (38)
Sleep Deprivation Narrative
A study was conducted to determine the effects of sleep deprivation on people's ability to solve s. The amount of sleep deprivation varied with 8, 12, 16, 20, and 24 hours without sleep. A total of ten subjects participated in the study, two at each sleep deprivation level. After his or her specified sleep deprivation period, each subject was administered a set of simple addition s, and the number of errors was recorded. These results were obtained:
-Refer to Sleep Deprivation Narrative. Do the data present sufficient evidence at the 1% level of significance to indicate that the number of errors is linearly related to the number of hours without sleep? Identify the two test statistics in the printout that can be used to answer this question.
(Essay)
4.8/5 (27)
Sleep Deprivation Narrative
A study was conducted to determine the effects of sleep deprivation on people's ability to solve s. The amount of sleep deprivation varied with 8, 12, 16, 20, and 24 hours without sleep. A total of ten subjects participated in the study, two at each sleep deprivation level. After his or her specified sleep deprivation period, each subject was administered a set of simple addition s, and the number of errors was recorded. These results were obtained:
-Refer to Sleep Deprivation Narrative. How many pairs of observations are in the experiment? What are the total number of degrees of freedom?
(Essay)
4.8/5 (28)
Forest Age and Tree Diameter Narrative
A scientist is studying the relationship between the age of a forest, x, in years and the average diameter of the trees, y, in cm. One study reported the following data.  -Refer to Forest Age and Tree Diameter Narrative. Develop a 95% confidence interval for the average value of y when x = 83.
(Essay)
5.0/5 (37)
Sunshine and Skin Cancer Narrative
A medical statistician wanted to examine the relationship between the amount of sunshine (x) in hours, and incidence of skin cancer (y). As an experiment, he found the number of skin cancers detected per 100,000 of population and the average daily sunshine in eight counties around the country. These data are shown below:  -Refer to Sunshine and Skin Cancer Narrative. Calculate the residual corresponding to the pair (x, y) = (8, 15).
(Essay)
4.8/5 (37)
Income and Education Narrative
A professor of economics wants to study the relationship between income (y in $1,000s) and education (x in years). A random sample eight individuals is taken and the results are shown below.  -Refer to Income and Education Narrative. Estimate the income of an individual with 15 years of education.
(Essay)
4.9/5 (38)
Sales and Experience Narrative
The general manager of a chain of furniture stores believes that experience is the most important factor in determining the level of success of a salesperson. To examine this belief, she records last month's sales (in $1000s) and the years of experience of ten randomly selected salespeople. These data are listed below.  -Refer to Sales and Experience Narrative. Draw a scatter diagram of the data to determine whether a linear model appears to be appropriate.
(Essay)
4.7/5 (35)
Salary and Years Narrative
A company manager is interested in the relationship between x = number of years that an employee has been with the company and y = the employee's annual salary (in thousands of dollars). The following statistical software output is from a regression analysis for predicting y from x for n = 15 data points.  s = 0.8081 R-sq = 97.9% R-sq(adj) = 97.8%
-Refer to Salary and Years Narrative. Find and interpret the correlation coefficient.
s = 0.8081 R-sq = 97.9% R-sq(adj) = 97.8%
-Refer to Salary and Years Narrative. Find and interpret the correlation coefficient.
(Essay)
4.8/5 (33)
Wind Velocity and Windmills Narrative
A scientist is studying the relationship between wind velocity (x in km/h) and DC output of a windmill (y). The following MINITAB output is from a regression analysis for predicting y from x.  s = 0.2435 R-sq = 88.3% R-sq(adj) = 87.3%
Analysis of Variance
s = 0.2435 R-sq = 88.3% R-sq(adj) = 87.3%
Analysis of Variance  -Refer to Wind Velocity and Windmills Narrative. One of the assumptions about the random error
  in the regression model is that the values of
  have a common variance equal to
  . What is the best estimator of ?
(Essay)
4.7/5 (36)
Lumber Weight Narrative
Let x be the weight in tonnes (1 tonne = 1000 kg) of a load of lumber and y be the time (in hours) it takes to load it onto a truck. A simple linear regression model relates x and y where the least-squares estimates of the regression parameters are b = 6.5 and a = 3.3.
-Refer to Lumber Weight Narrative. What is the average change in time per one tonne increase in weight?
(Essay)
4.8/5 (34)
Extra Help Sessions Narrative
A study was conducted to determine the effect of extra help sessions attended on students' ability to avoid mistakes on a 20-question test. The data shown below represent the number of extra help sessions attended (x) and the average number of mistakes (y) recorded.
-Refer to Extra Help Sessions Narrative. Calculate the coefficient of determination,  . What information does this value give about the usefulness of the linear model?
(Essay)
4.9/5 (38)
Filters
- Essay(0)
- Multiple Choice(0)
- Short Answer(0)
- True False(0)
- Matching(0)