Exam 12: B: linear Regression and Correlation
Exam 1: Describing Data With Graphs134 Questions
Exam 2: Describing Data With Numerical Measures235 Questions
Exam 3: Describing Bivariate Data57 Questions
Exam 4: A: probability and Probability Distributions107 Questions
Exam 4: B: probability and Probability Distributions157 Questions
Exam 5: Several Useful Discrete Distributions166 Questions
Exam 6: The Normal Probability Distribution235 Questions
Exam 7: Sampling Distributions231 Questions
Exam 8: Large-Sample Estimation187 Questions
Exam 9: A: large-Sample Tests of Hypotheses154 Questions
Exam 9: B: large-Sample Tests of Hypotheses106 Questions
Exam 10: A: Inference From Small Samples192 Questions
Exam 10: B: Inference From Small Samples124 Questions
Exam 11: A: The Analysis of Variance136 Questions
Exam 11: B: The Analysis of Variance137 Questions
Exam 12: A: linear Regression and Correlation131 Questions
Exam 12: B: linear Regression and Correlation171 Questions
Exam 13: Multiple Regression Analysis232 Questions
Exam 14: Analysis of Categorical Data158 Questions
Exam 15: A:nonparametric Statistics139 Questions
Exam 15: B:nonparametric Statistics95 Questions
Select questions type
Income and Attractiveness Narrative
In order to determine whether good looks translate into heftier paycheques, an economist collected the data shown below on annual income of doctors (y) in thousands of dollars and attractiveness (x) as recorded on a scale from 1 to 5, based on a panel's rating of head-and-shoulder photographs. 
 -Refer to Income and Attractiveness Narrative. The plot of residuals versus the fitted values is shown below. Does it appear that the constant variance regression assumption has been violated? Explain.
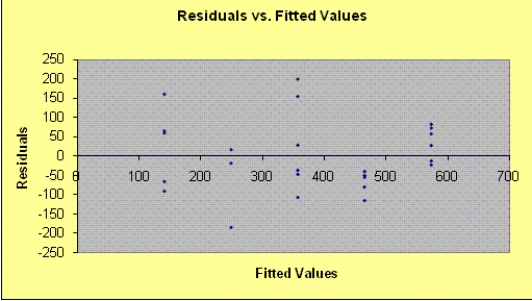
(Essay)
4.9/5  (23)
(23)
Income and Attractiveness Narrative
In order to determine whether good looks translate into heftier paycheques, an economist collected the data shown below on annual income of doctors (y) in thousands of dollars and attractiveness (x) as recorded on a scale from 1 to 5, based on a panel's rating of head-and-shoulder photographs.
-Refer to Income and Attractiveness Narrative. The normal probability plot is shown below. Does it appear that the normality regression assumption has been violated? Explain. 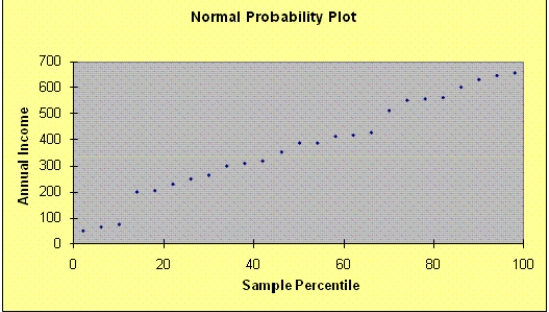
(Essay)
4.9/5 (29)
Age of Forest and Diameter of Trees
A scientist is studying the relationship between age of a forest, x, in years and the average diameter of the trees, y, in cm. One study reported the following data.  -Refer to Age of Forest and Diameter of Trees. Estimate
  using a 90% confidence interval.
(Essay)
4.9/5 (42)
Young Aspen Trees and Growth Narrative
Let x be the number of leaves on a young aspen tree and let y be the growth of the tree (in mm). The data are as follows.  -Refer to Young Aspen Trees and Growth Narrative. Develop a scatterplot for this data.
(Essay)
4.9/5 (37)
Income and Height Narrative
Do tall men earn more than short ones? An economist collected the data shown below for 25 men, where the annual income (y) in thousands of dollars and the height of the income earner (x) in cm. 
 -Refer to Income and Height Narrative. Compare the two-tailed critical value for the t test with the critical value for the F statistic. What is the relationship between the two values?
(Essay)
4.8/5 (32)
Vending Machines Narrative
Let x be the number of vending machines and let y be the time (in hours) it takes to stock them. The data are as follows.  -Refer to Vending Machines Narrative. What percentage of the total variation in y can be explained by the simple linear regression model?
(Essay)
4.8/5 (32)
Microwave Sales Narrative
A microwave oven manufacturer has collected the data shown below on number of units sold (y) in the thousands of dollars and the number of ads (x) placed during the month. 
 -Refer to Microwave Sales Narrative. Compute a 95% prediction interval for sales during the next month that happens to be associated with 140 ads.
(Essay)
4.8/5 (38)
Ice Cream Sales Narrative
The manager of an ice cream store is interested in examining the relationship between sales of ice cream (in litres per day) and maximum temperature of the day. The vendor records the following data for a random sample of five days in the summer, where y is number of litres of ice cream sold per day and x is maximum temperature, in degrees Celsius, recorded for the day:  The following summary information was computed:
 -Refer to Ice Cream Sales Narrative. Find the least-squares prediction line.
(Essay)
4.8/5 (37)
Income and Education Narrative
A professor of economics wants to study the relationship between income (y in $1,000s) and education (x in years). A random sample eight individuals is taken and the results are shown below.  -Refer to Income and Education Narrative. Draw a scatter diagram of the data to determine whether a linear model appears to be appropriate.
(Essay)
4.9/5 (37)
Lumber Weight Narrative
Let x be the weight in tonnes (1 tonne = 1000 kg) of a load of lumber and y be the time (in hours) it takes to load it onto a truck. A simple linear regression model relates x and y where the least-squares estimates of the regression parameters are b = 6.5 and a = 3.3.
-Refer to Lumber Weight Narrative. What is the least-squares best-fitting regression line?
(Essay)
4.9/5 (42)
Weight and Height Narrative
Evidence supports using a simple linear regression model to estimate a person's weight based on a person's height. Let x be a person's height (measured in cm) and y be the person's weight (measured in kg). A random sample of 11 people was selected and the following data recorded:  The following output was generated using statistical software:
 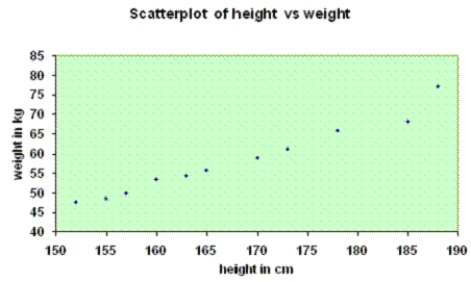 Regression Analysis
The regression equation is
y = -148 + 4.18x
Regression Analysis
The regression equation is
y = -148 + 4.18x  S = 1.7698; R-Sq = 96.7%; R-Sq(adj) = 96.3%
Analysis of Variance Table
S = 1.7698; R-Sq = 96.7%; R-Sq(adj) = 96.3%
Analysis of Variance Table  Unusual Observations
  denotes an observation with a large standardized residual.
-Refer to Weight and Height Narrative. Use the printout to find the least-squares prediction line.
denotes an observation with a large standardized residual.
-Refer to Weight and Height Narrative. Use the printout to find the least-squares prediction line.
(Essay)
4.8/5 (33)
Sales and Experience Narrative
The general manager of a chain of furniture stores believes that experience is the most important factor in determining the level of success of a salesperson. To examine this belief, she records last month's sales (in $1000s) and the years of experience of ten randomly selected salespeople. These data are listed below.  -Refer to Sales and Experience Narrative. Conduct a test of the population slope to determine at the 5% significance level whether a linear relationship exists between years of experience and sales.
(Essay)
4.9/5 (29)
Salary and Years Narrative
A company manager is interested in the relationship between x = number of years that an employee has been with the company and y = the employee's annual salary (in thousands of dollars). The following statistical software output is from a regression analysis for predicting y from x for n = 15 data points.  s = 0.8081 R-sq = 97.9% R-sq(adj) = 97.8%
-Refer to Salary and Years Narrative. What are the least-squares estimates of the slope and the y-intercept?
s = 0.8081 R-sq = 97.9% R-sq(adj) = 97.8%
-Refer to Salary and Years Narrative. What are the least-squares estimates of the slope and the y-intercept?
(Essay)
4.8/5 (35)
Willie Nelson Concert Narrative
At a recent Willie Nelson concert, a survey was conducted that asked a random sample of 20 people their age and how many concerts they have attended since the first of the year. The following data were collected: 
 An Excel output follows:
 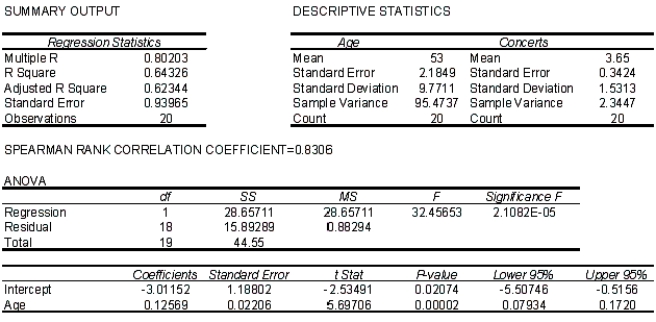 -Refer to Willie Nelson Concert Narrative. Draw a histogram of the residuals.
(Essay)
4.9/5 (31)
Correlation between Shoreline Erosion and Rainfall
A scientist is studying the relationship between x = centimetres of annual rainfall and y = centimetres of shoreline erosion. One study reported the following data. Use the following statistical software output to answer the questions below. 
 s = 0.2416 R-sq = 98.8% R-sq(adj) = 98.6%
Analysis of Variance
s = 0.2416 R-sq = 98.8% R-sq(adj) = 98.6%
Analysis of Variance  -Refer to Correlation between Shoreline Erosion and Rainfall. Is the simple linear regression model useful for predicting erosion from a given amount of rainfall? Test the following hypotheses.
(Essay)
4.9/5 (29)
Willie Nelson Concert Narrative
At a recent Willie Nelson concert, a survey was conducted that asked a random sample of 20 people their age and how many concerts they have attended since the first of the year. The following data were collected: An Excel output follows:
-Refer to Willie Nelson Concert Narrative. Does it appear that random variables is a ? Explain.
(Essay)
4.9/5 (31)
Ice Cream Sales Narrative
The manager of an ice cream store is interested in examining the relationship between sales of ice cream (in litres per day) and maximum temperature of the day. The vendor records the following data for a random sample of five days in the summer, where y is number of litres of ice cream sold per day and x is maximum temperature, in degrees Celsius, recorded for the day: The following summary information was computed:
-Refer to Ice Cream Sales Narrative. Would you use the least-squares prediction equation line to find the estimated sales of ice cream for a maximum daily temperature of 6°C? Why or why not?
(Essay)
5.0/5 (31)
Salary and Years Narrative
A company manager is interested in the relationship between x = number of years that an employee has been with the company and y = the employee's annual salary (in thousands of dollars). The following statistical software output is from a regression analysis for predicting y from x for n = 15 data points. s = 0.8081 R-sq = 97.9% R-sq(adj) = 97.8%
-Refer to Salary and Years Narrative. Does a linear relationship exist between x and y? Test using  = 0.05.
(Essay)
4.8/5 (32)
Income and Height Narrative
Do tall men earn more than short ones? An economist collected the data shown below for 25 men, where the annual income (y) in thousands of dollars and the height of the income earner (x) in cm.
-Refer to Income and Height Narrative. Calculate the preliminary sums of squares and cross-products, 
(Essay)
4.8/5 (35)
Lumber Weight Narrative
Let x be the weight in tonnes (1 tonne = 1000 kg) of a load of lumber and y be the time (in hours) it takes to load it onto a truck. A simple linear regression model relates x and y where the least-squares estimates of the regression parameters are b = 6.5 and a = 3.3.
-Refer to Lumber Weight Narrative. Interpret the y-intercept of the regression line.
(Essay)
4.8/5 (34)
Filters
- Essay(0)
- Multiple Choice(0)
- Short Answer(0)
- True False(0)
- Matching(0)