Exam 12: B: linear Regression and Correlation
Exam 1: Describing Data With Graphs134 Questions
Exam 2: Describing Data With Numerical Measures235 Questions
Exam 3: Describing Bivariate Data57 Questions
Exam 4: A: probability and Probability Distributions107 Questions
Exam 4: B: probability and Probability Distributions157 Questions
Exam 5: Several Useful Discrete Distributions166 Questions
Exam 6: The Normal Probability Distribution235 Questions
Exam 7: Sampling Distributions231 Questions
Exam 8: Large-Sample Estimation187 Questions
Exam 9: A: large-Sample Tests of Hypotheses154 Questions
Exam 9: B: large-Sample Tests of Hypotheses106 Questions
Exam 10: A: Inference From Small Samples192 Questions
Exam 10: B: Inference From Small Samples124 Questions
Exam 11: A: The Analysis of Variance136 Questions
Exam 11: B: The Analysis of Variance137 Questions
Exam 12: A: linear Regression and Correlation131 Questions
Exam 12: B: linear Regression and Correlation171 Questions
Exam 13: Multiple Regression Analysis232 Questions
Exam 14: Analysis of Categorical Data158 Questions
Exam 15: A:nonparametric Statistics139 Questions
Exam 15: B:nonparametric Statistics95 Questions
Select questions type
Special Programs Narrative
A social skills training program was implemented with seven students with disabilities in a study to determine whether the program caused improvement in pre/post measures and behaviour ratings. For one such test, the pre- and posttest scores for the seven students are given in the table.  -Refer to Special Programs Narrative. Calculate the correlation coefficient r. Is there a significant positive correlation between x and y? Explain.
(Essay)
5.0/5  (34)
(34)
Sleep Deprivation Narrative
A study was conducted to determine the effects of sleep deprivation on people's ability to solve s. The amount of sleep deprivation varied with 8, 12, 16, 20, and 24 hours without sleep. A total of ten subjects participated in the study, two at each sleep deprivation level. After his or her specified sleep deprivation period, each subject was administered a set of simple addition s, and the number of errors was recorded. These results were obtained:  -Refer to Sleep Deprivation Narrative. What is the least-squares prediction equation?
(Essay)
4.7/5 (39)
Extra Help Sessions Narrative
A study was conducted to determine the effect of extra help sessions attended on students' ability to avoid mistakes on a 20-question test. The data shown below represent the number of extra help sessions attended (x) and the average number of mistakes (y) recorded.  -Refer to Extra Help Sessions Narrative. Use the least-squares line to predict the value of y when x = 3.5.
(Essay)
4.8/5 (35)
SAT Scores and GPA Narrative
A university admissions committee was interested in examining the relationship between a student's score on the Scholastic Aptitude Test, x, and the student's grade point average, y, at the end of the student's first year of university. The committee selected a random sample of 25 students and recorded the SAT score and GPA at the end of the first year of university for each student. Use the following output that was generated using statistical software to answer the questions below:
Regression Analysis
The regression equation is
GPA = -1.09 + 0.00349 SAT  S = 0.1463 R-Sq = 91.8% R-Sq(adj) = 91.5%
Analysis of Variance
S = 0.1463 R-Sq = 91.8% R-Sq(adj) = 91.5%
Analysis of Variance  Correlations (Pearson)
Correlation of SAT and GPA = 0.958
-Refer to SAT Scores and GPA Narrative. Use the information above to find the least-squares prediction line.
Correlations (Pearson)
Correlation of SAT and GPA = 0.958
-Refer to SAT Scores and GPA Narrative. Use the information above to find the least-squares prediction line.
(Essay)
4.8/5 (32)
Correlation between Shoreline Erosion and Rainfall
A scientist is studying the relationship between x = centimetres of annual rainfall and y = centimetres of shoreline erosion. One study reported the following data. Use the following statistical software output to answer the questions below. 
 s = 0.2416 R-sq = 98.8% R-sq(adj) = 98.6%
Analysis of Variance
s = 0.2416 R-sq = 98.8% R-sq(adj) = 98.6%
Analysis of Variance  -Refer to Correlation between Shoreline Erosion and Rainfall. What is the equation of the estimated regression line?
(Essay)
4.9/5 (33)
Sales and Experience Narrative
The general manager of a chain of furniture stores believes that experience is the most important factor in determining the level of success of a salesperson. To examine this belief, she records last month's sales (in $1000s) and the years of experience of ten randomly selected salespeople. These data are listed below.  -Refer to Sales and Experience Narrative. Estimate with 95% confidence the average monthly sales of all salespersons with ten years of experience.
(Essay)
4.8/5 (41)
Young Aspen Trees and Growth Narrative
Let x be the number of leaves on a young aspen tree and let y be the growth of the tree (in mm). The data are as follows.  -Refer to Young Aspen Trees and Growth Narrative. Use a statistical software package of your choice and report the regression analysis results.
(Essay)
4.8/5 (39)
Vending Machines Narrative
Let x be the number of vending machines and let y be the time (in hours) it takes to stock them. The data are as follows.  -Refer to Vending Machines Narrative. Construct a scatterplot for this data including the least-squares regression line.
(Essay)
4.9/5 (26)
Willie Nelson Concert Narrative
At a recent Willie Nelson concert, a survey was conducted that asked a random sample of 20 people their age and how many concerts they have attended since the first of the year. The following data were collected: 
 An Excel output follows:
 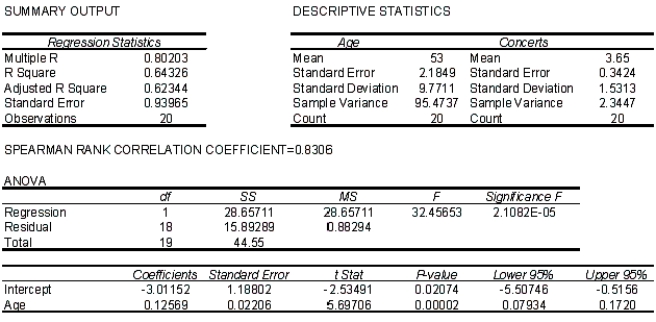 -Refer to Willie Nelson Concert Narrative. Plot the residuals in against the predicted values
  .
.
(Essay)
4.9/5 (37)
Amount of Trees and Beavers
A scientist is studying the relationship between x = density (in number per square metre) of aspen trees around a pond and y = beaver abundance. The following statistical software output is from a regression analysis for predicting y from x.  s = 0.4839 R-sq = 97.0% R-sq(adj) = 96.5%
Analysis of Variance
s = 0.4839 R-sq = 97.0% R-sq(adj) = 96.5%
Analysis of Variance  -Refer to Amount of Trees and Beavers. What is the value of the error sum of squares?
(Short Answer)
4.9/5 (31)
Young Aspen Trees and Growth Narrative
Let x be the number of leaves on a young aspen tree and let y be the growth of the tree (in mm). The data are as follows.
-Refer to Young Aspen Trees and Growth Narrative. What does the scatterplot developed in the previous question indicate about the relationship between the two variables?
(Essay)
4.8/5 (32)
Filters
- Essay(0)
- Multiple Choice(0)
- Short Answer(0)
- True False(0)
- Matching(0)