Exam 26: Simulation
Exam 1: Operations and Productivity126 Questions
Exam 2: Operations Strategy in a Global Environment135 Questions
Exam 3: Project Management122 Questions
Exam 4: Forecasting144 Questions
Exam 5: Design of Goods and Services137 Questions
Exam 6: Managing Quality130 Questions
Exam 18: Statistical Process Control156 Questions
Exam 7: Process Strategy and Sustainability131 Questions
Exam 19: Capacity and Constraint Management107 Questions
Exam 8: Location Strategies140 Questions
Exam 9: Layout Strategies161 Questions
Exam 10: Human Resources,job Design,and Work Measurement192 Questions
Exam 11: Supply-Chain Management145 Questions
Exam 20: Outsourcing As a Supply-Chain Strategy73 Questions
Exam 12: Inventory Management171 Questions
Exam 13: Aggregate Planning134 Questions
Exam 14: Material Requirements Planning Mrpand Erp169 Questions
Exam 15: Short-Term Scheduling139 Questions
Exam 16: Jit and Lean Operations138 Questions
Exam 17: Maintenance and Reliability130 Questions
Exam 21: Decision-Making Tools97 Questions
Exam 22: Linear Programming100 Questions
Exam 23: Transportation Models94 Questions
Exam 24: Waiting-Line Models135 Questions
Exam 25: Learning Curves111 Questions
Exam 26: Simulation92 Questions
Select questions type
A simulation model is designed to arrive at a single specific numerical answer to a given problem.
(True/False)
4.9/5  (35)
(35)
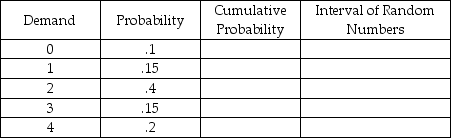
Create a distribution of random numbers that would result in average demand per period for a Monte Carlo simulation that is equivalent to the expected demand per period using the data given by the chart below.
(Essay)
4.9/5 (35)
A distribution of lead times in an inventory problem indicates that lead time was 1 day 20% of the time,2 days 30% of the time,3 days 30% of the time,and.4 days 20% of the time.This distribution has been prepared for Monte Carlo analysis.The first four random numbers drawn are 06,63,57,and 02.The average lead time of this simulation is
(Multiple Choice)
4.8/5 (26)
Explain what is meant by the concept of "time compression" in simulation modeling.
(Essay)
4.8/5 (38)
A(n)________ is the accumulation of individual probabilities of a distribution.
(Essay)
4.9/5 (43)
Monte Carlo simulations applied to queuing problems have what advantage?
(Multiple Choice)
4.8/5 (24)
Which of the following is not a disadvantage to simulation?
(Multiple Choice)
4.9/5 (38)
Explain what is meant by "simulation is not limited to using the standard probability distributions."
(Essay)
4.9/5 (29)
Simulation models that are based on the generation of random numbers may fail to give the same solution in repeated use to any particular problem.
(True/False)
4.7/5 (35)
A distribution of service times at a waiting line shows that service takes 6 minutes 40% of the time,7 minutes 30% of the time,8 minutes 20% of the time,and 9 minutes 10% of the time.Prepare the probability distribution,the cumulative probability distribution,and the random number intervals for this problem.The first five random numbers are 37,69,53,80,and 60.What is the average service time of this simulation run?
(Essay)
4.8/5 (44)
Which of the following is not an application of simulation in the area of operations?
(Multiple Choice)
4.7/5 (37)
Which of the following are advantages to simulation? I.Time compression
II.What-if questions are possible
III.Flexibility
IV.Trial and Error approach
V.Input must be user generated
(Multiple Choice)
4.8/5 (34)
Identify,in order,the five steps required to implement the Monte Carlo simulation technique.
(Essay)
4.9/5 (31)
A simulation is "Monte Carlo" when the elements of a system being simulated exhibit chance in their behavior.
(True/False)
4.9/5 (32)
A distribution of service times at a waiting line indicates that service takes 12 minutes 30% of the time and 14 minutes 70% of the time.This distribution has been prepared for Monte Carlo analysis.The first four random numbers drawn are 07,60,77,and 49.The average service time of this simulation is
(Multiple Choice)
4.8/5 (38)
The lunch counter at a small restaurant has difficulty handling the lunch business.Currently,there is only one cashier in a single-channel,single-phase system.The restaurant has collected information on the interarrival time,and service time distributions from past lunch hours.They are represented in the tables below.Use the following two-digit random numbers given below to simulate 10 customers through the checkout system.What is the average time in line,and average time in system? (Set first arrival time to the interarrival time generated by first random number.
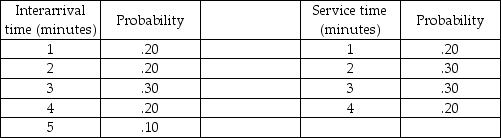 Random numbers for interarrival times: 32,73,41,38,73,01,09,64,34,44
Random numbers of service times: 84,55,25,71,34,57,50,44,95,64
Random numbers for interarrival times: 32,73,41,38,73,01,09,64,34,44
Random numbers of service times: 84,55,25,71,34,57,50,44,95,64
(Essay)
4.9/5 (28)
Filters
- Essay(0)
- Multiple Choice(0)
- Short Answer(0)
- True False(0)
- Matching(0)