Exam 18: Statistical Process Control
Exam 1: Operations and Productivity126 Questions
Exam 2: Operations Strategy in a Global Environment135 Questions
Exam 3: Project Management122 Questions
Exam 4: Forecasting144 Questions
Exam 5: Design of Goods and Services137 Questions
Exam 6: Managing Quality130 Questions
Exam 18: Statistical Process Control156 Questions
Exam 7: Process Strategy and Sustainability131 Questions
Exam 19: Capacity and Constraint Management107 Questions
Exam 8: Location Strategies140 Questions
Exam 9: Layout Strategies161 Questions
Exam 10: Human Resources,job Design,and Work Measurement192 Questions
Exam 11: Supply-Chain Management145 Questions
Exam 20: Outsourcing As a Supply-Chain Strategy73 Questions
Exam 12: Inventory Management171 Questions
Exam 13: Aggregate Planning134 Questions
Exam 14: Material Requirements Planning Mrpand Erp169 Questions
Exam 15: Short-Term Scheduling139 Questions
Exam 16: Jit and Lean Operations138 Questions
Exam 17: Maintenance and Reliability130 Questions
Exam 21: Decision-Making Tools97 Questions
Exam 22: Linear Programming100 Questions
Exam 23: Transportation Models94 Questions
Exam 24: Waiting-Line Models135 Questions
Exam 25: Learning Curves111 Questions
Exam 26: Simulation92 Questions
Select questions type
Which of the following is true about cutting costs at Canada Bankers Life Assurance Company?
Free
(Multiple Choice)
4.9/5  (35)
(35)
Correct Answer: Verified
A
The statistical definition of Six Sigma allows for 3.4 defects per million.This is achieved by a Cpk index of
Free
(Multiple Choice)
4.8/5 (35)
Correct Answer:Verified
E
If μ = 9 ounces,σ = 0.5 ounces,and n = 9,calculate the 3-sigma control limits.
(Essay)
4.9/5 (34)
Mistakes stemming from workers' inadequate training represent an assignable cause of variation.
(True/False)
4.7/5 (41)
In the table below are selected values for the OC curve for the acceptance sampling plan n=210,c=6.Upon failed inspection,defective items are replaced.Calculate the AOQ for each data point.(You may assume that the population is much larger than the sample. )Plot the AOQ curve.At approximately what population defective rate is the AOQ at its worst? Explain how this happens.How well does this plan meet the specifications of AQL = 0.015,α = 0.05;LTPD = 0.05,β=0.10? Discuss.
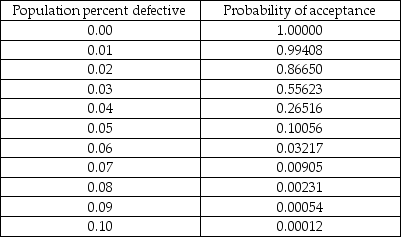
(Essay)
4.8/5 (43)
The mean and standard deviation for a process for which we have a substantial history are μ = 120 and σ = 2.For the x-bar chart,a sample size of 16 will be used.What is the mean of the sampling distribution?
(Multiple Choice)
4.9/5 (22)
The steeper an OC curve,the better it discriminates between good and bad lots.
(True/False)
4.9/5 (34)
What is the difference between the process capability ratio Cp and the process capability index Cpk?
(Essay)
4.7/5 (36)
A quality analyst wants to construct a sample mean chart for controlling a packaging process.He knows from past experience that when the process is operating as intended,packaging weight is normally distributed with a mean of twenty ounces,and a process standard deviation of two ounces.Each day last week,he randomly selected four packages and weighed each.The data from that activity appears below. 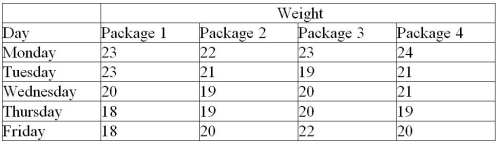 (a)If he sets an upper control limit of 21 and a lower control limit of 19 around the target value of twenty ounces,what is the probability of concluding that this process is out of control when it is actually in control?
(b)With the UCL and LCL of part a,what do you conclude about this process-is it in control?
(a)If he sets an upper control limit of 21 and a lower control limit of 19 around the target value of twenty ounces,what is the probability of concluding that this process is out of control when it is actually in control?
(b)With the UCL and LCL of part a,what do you conclude about this process-is it in control?
(Essay)
4.7/5 (35)
A part that connects two levels should have a distance between the two holes of 4".It has been determined that x-bar and R-charts should be set up to determine if the process is in statistical control.The following ten samples of size four were collected.Calculate the control limits,plot the control charts,and determine if the process is in control.
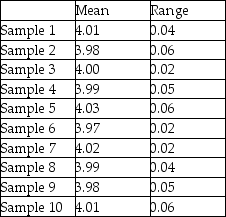
(Essay)
4.7/5 (29)
Briefly explain what the Central Limit Theorem has to do with control charts.
(Essay)
4.7/5 (35)
Plots of sample ranges indicate that the most recent value is below the lower control limit.What course of action would you recommend?
(Multiple Choice)
4.7/5 (35)
The x-bar chart,like the c-chart,is based on the exponential distribution.
(True/False)
4.8/5 (39)
A process range chart illustrates the amount of variation within the samples.
(True/False)
4.7/5 (33)
Filters
- Essay(0)
- Multiple Choice(0)
- Short Answer(0)
- True False(0)
- Matching(0)