Exam 4: Forecasting
Exam 1: Operations and Productivity127 Questions
Exam 2: Operations Strategy in a Global Environment119 Questions
Exam 3: Project Management120 Questions
Exam 4: Forecasting141 Questions
Exam 5: Design of Goods and Services118 Questions
Exam 6: Managing Quality127 Questions
Exam 7: Process Strategy108 Questions
Exam 8: Location Strategies120 Questions
Exam 9: Layout Strategies145 Questions
Exam 10: Human Resources,job Design,and Work Measurement154 Questions
Exam 11: Supply Chain Management145 Questions
Exam 12: Inventory Management163 Questions
Exam 13: Aggregate Planning and Sop116 Questions
Exam 14: Material Requirements Planning Mrpand Erp116 Questions
Exam 15: Short-Term Scheduling115 Questions
Exam 16: Jit,tps,and Lean Operations115 Questions
Exam 17: Maintenance and Reliability111 Questions
Exam 18: Sustainability in the Supply Chain80 Questions
Exam 19: Statistical Process Control144 Questions
Exam 20: Capacity and Constraint Management96 Questions
Exam 21: Supply Chain Management Analytics55 Questions
Exam 22: Decision-Making Tools96 Questions
Exam 23: Linear Programming88 Questions
Exam 24: Transportation Models89 Questions
Exam 25: Waiting-Line Models119 Questions
Exam 26: Learning Curves110 Questions
Exam 27: Simulation74 Questions
Select questions type
Which time-series model uses BOTH past forecasts and past demand data to generate a new forecast?
Free
(Multiple Choice)
4.8/5  (35)
(35)
Correct Answer: Verified
D
Demand for a certain product is forecast to be 8,000 units per month,averaged over all 12 months of the year.The product follows a seasonal pattern,for which the January monthly index is 1.25.What is the seasonally-adjusted sales forecast for January?
Free
(Essay)
4.9/5 (31)
Correct Answer:Verified
8,000 × 1.25 = 10,000
Name and discuss three qualitative forecasting methods.
Free
(Essay)
4.8/5 (36)
Correct Answer:Verified
Qualitative forecasting methods include: jury of executive opinion,where high-level managers arrive at a group estimate of demand;sales force composite,where salespersons' estimates are aggregated;Delphi method,which uses a group process that allows experts to make forecasts;and market survey,where consumers are queried about their future purchasing plans.
Forecasts are usually classified by time horizon into which three categories?
(Multiple Choice)
4.8/5 (24)
A forecast with a time horizon of about 3 months to 3 years is typically called a:
(Multiple Choice)
4.8/5 (38)
Weekly sales of ten-grain bread at the local organic food market are provided in the table below.Based on these data,forecast week 9 using a five-week moving average.
Week Sales
1 415
2 389
3 420
4 382
5 410
6 432
7 405
8 421
(Essay)
4.8/5 (39)
The sales force composite forecasting method relies on salespersons' estimates of expected sales.
(True/False)
4.9/5 (23)
Linear regression is known as a(n)________ model because it incorporates variables or factors that might influence the quantity being forecast.
(Essay)
4.9/5 (30)
The last seven weeks of demand at a new car dealer are shown below.Use a three-period weighted-moving average forecast to determine a forecast for the 8th week using weights of 3,2,and 1 (where the most recent week receives the highest weight).(Round all forecasts to the nearest whole unit. )Calculate the MAD for this forecast (covering all weeks in which error comparisons can be made).What does the MAD indicate?
Week Sales
1 25
2 30
3 27
4 31
5 27
6 29
7 30
(Essay)
4.8/5 (37)
A restaurant has tracked the number of meals served at lunch over the last four weeks.The data show little in terms of trends,but do display substantial variation by day of the week.Use the following information to determine the seasonal (daily)indices for this restaurant.
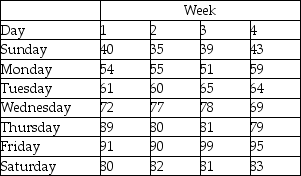
(Essay)
4.9/5 (38)
A measure of forecast error that does not depend upon the magnitude of the item being forecast is the ________.
(Essay)
4.9/5 (27)
What are the differences between quantitative and qualitative forecasting methods?
(Essay)
4.9/5 (31)
What is the forecast for May based on a weighted moving average applied to the following past demand data and using the weights: 4,3,2 (largest weight is for most recent data)?
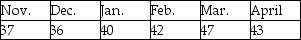
(Essay)
5.0/5 (40)
________ forecasts address the business cycle by predicting inflation rates,money supplies,housing starts,and other planning indicators.
(Essay)
5.0/5 (34)
The degree or strength of a relationship between two variables is shown by the:
(Multiple Choice)
4.9/5 (39)
If two variables were perfectly correlated,what would the coefficient of correlation r equal?
(Multiple Choice)
4.9/5 (31)
Given the following data,calculate the three-year moving averages for years 4 through 10.
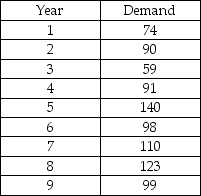
(Essay)
4.9/5 (29)
Filters
- Essay(0)
- Multiple Choice(0)
- Short Answer(0)
- True False(0)
- Matching(0)