Exam 19: Statistical Process Control
Exam 1: Operations and Productivity127 Questions
Exam 2: Operations Strategy in a Global Environment119 Questions
Exam 3: Project Management120 Questions
Exam 4: Forecasting141 Questions
Exam 5: Design of Goods and Services118 Questions
Exam 6: Managing Quality127 Questions
Exam 7: Process Strategy108 Questions
Exam 8: Location Strategies120 Questions
Exam 9: Layout Strategies145 Questions
Exam 10: Human Resources,job Design,and Work Measurement154 Questions
Exam 11: Supply Chain Management145 Questions
Exam 12: Inventory Management163 Questions
Exam 13: Aggregate Planning and Sop116 Questions
Exam 14: Material Requirements Planning Mrpand Erp116 Questions
Exam 15: Short-Term Scheduling115 Questions
Exam 16: Jit,tps,and Lean Operations115 Questions
Exam 17: Maintenance and Reliability111 Questions
Exam 18: Sustainability in the Supply Chain80 Questions
Exam 19: Statistical Process Control144 Questions
Exam 20: Capacity and Constraint Management96 Questions
Exam 21: Supply Chain Management Analytics55 Questions
Exam 22: Decision-Making Tools96 Questions
Exam 23: Linear Programming88 Questions
Exam 24: Transportation Models89 Questions
Exam 25: Waiting-Line Models119 Questions
Exam 26: Learning Curves110 Questions
Exam 27: Simulation74 Questions
Select questions type
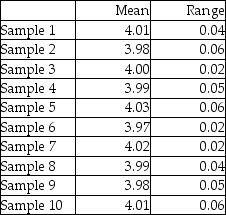
A part that connects two levels should have a distance between the two holes of 4".It has been determined that x-bar and R-charts should be set up to determine if the process is in statistical control.The following ten samples of size four were collected.Calculate the control limits,plot the control charts,and determine if the process is in control.
Free
(Essay)
4.8/5  (30)
(30)
Correct Answer: Verified
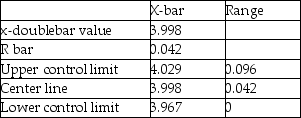
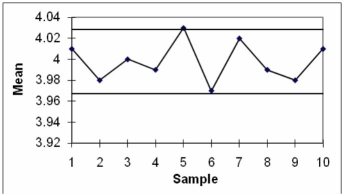
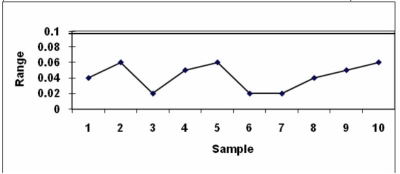 The process is out of control because of sample 5 on the x-bar chart.
The specification for a plastic handle calls for a length of 6.0 inches ± .2 inches.The standard deviation of the process is estimated to be 0.05 inches.What are the upper and lower specification limits for this product? The process is known to operate at a mean thickness of 6.1 inches.What are the Cp and Cpk values for this process? Is this process capable of producing the desired part?
Free
(Essay)
4.8/5 (35)
Correct Answer:Verified
LSL = 5.8 inches,USL = 6.2 inches.Cp is (6.2-5.8)/6(.05)= 1.33.Cpk is the lesser of
(6.2 - 6.1)/(3*0.05)= .67 and (6.1 - 5.8)/(3*0.02)= 2.00;therefore,.67.The process is capable based upon the Cp.However,the process is not centered (based upon its Cpk)and based upon its current center is not producing parts that are of an acceptable quality.
The upper and lower limits for diving ring diameters made by John's Swimming Co.are 40 and 39 cm. ,respectively.John took 11 samples with the following average diameters (39,39.1,39.2,39.3,39.4,39.5 39.6,39.7,39.8,39.9,40).Is the process in control?
Free
(Multiple Choice)
4.9/5 (30)
Correct Answer:Verified
C
The purpose of an x-bar chart is to determine whether there has been a:
(Multiple Choice)
4.7/5 (31)
A process that is assumed to be in control with limits of 89 ± 2 had sample averages for the x-bar chart of the following: 87.1,87,87.2,89,90,88.5,89.5,and 88.Is the process in control?
(Multiple Choice)
4.9/5 (33)
What is the difference between natural and assignable causes of variation?
(Essay)
4.7/5 (34)
Mistakes stemming from workers' inadequate training represent an assignable cause of variation.
(True/False)
4.8/5 (36)
A p-chart is appropriate to plot the number of typographic errors per page of text.
(True/False)
4.9/5 (35)
The statistical definition of Six Sigma allows for 3.4 defects per million.This is achieved by what Cpk index value?
(Multiple Choice)
4.9/5 (39)
A lot that is accepted by acceptance sampling is certified to be free of defects.
(True/False)
4.8/5 (33)
The steeper an OC curve,the better it discriminates between good and bad lots.
(True/False)
4.9/5 (36)
The number of late insurance claim payouts per 100 should be measured with what type of control chart?
(Multiple Choice)
4.9/5 (31)
The number of defects after a hotel room cleaning (sheets not straight,smears on mirror,missed debris on carpet,etc)should be measured using what type of control chart?
(Multiple Choice)
4.9/5 (34)
________ is variation in a production process that can be traced to specific causes.
(Essay)
4.9/5 (35)
The ________ is a quality control chart used to control the number of defects per unit of output.
(Essay)
4.8/5 (47)
Filters
- Essay(0)
- Multiple Choice(0)
- Short Answer(0)
- True False(0)
- Matching(0)