Exam 27: Simulation
Exam 1: Operations and Productivity127 Questions
Exam 2: Operations Strategy in a Global Environment119 Questions
Exam 3: Project Management120 Questions
Exam 4: Forecasting141 Questions
Exam 5: Design of Goods and Services118 Questions
Exam 6: Managing Quality127 Questions
Exam 7: Process Strategy108 Questions
Exam 8: Location Strategies120 Questions
Exam 9: Layout Strategies145 Questions
Exam 10: Human Resources,job Design,and Work Measurement154 Questions
Exam 11: Supply Chain Management145 Questions
Exam 12: Inventory Management163 Questions
Exam 13: Aggregate Planning and Sop116 Questions
Exam 14: Material Requirements Planning Mrpand Erp116 Questions
Exam 15: Short-Term Scheduling115 Questions
Exam 16: Jit,tps,and Lean Operations115 Questions
Exam 17: Maintenance and Reliability111 Questions
Exam 18: Sustainability in the Supply Chain80 Questions
Exam 19: Statistical Process Control144 Questions
Exam 20: Capacity and Constraint Management96 Questions
Exam 21: Supply Chain Management Analytics55 Questions
Exam 22: Decision-Making Tools96 Questions
Exam 23: Linear Programming88 Questions
Exam 24: Transportation Models89 Questions
Exam 25: Waiting-Line Models119 Questions
Exam 26: Learning Curves110 Questions
Exam 27: Simulation74 Questions
Select questions type
A distribution of lead times in an inventory problem indicates that lead time was 1 day 20 percent of the time,2 days 30 percent of the time,3 days 30 percent of the time,and 4 days 20 percent of the time.This distribution has been prepared for Monte Carlo analysis.The first four random numbers drawn are 06,63,57,and 02.What is the average lead time of this simulation?
Free
(Multiple Choice)
4.8/5  (39)
(39)
Correct Answer: Verified
B
A distribution of service times at a waiting line shows that service takes 6 minutes 30 percent of the time,7 minutes 40 percent of the time,8 minutes 20 percent of the time,and 9 minutes 10 percent of the time.This distribution has been prepared for Monte Carlo analysis.The first two random numbers drawn are 53 and 74.The simulated service times are ________ minutes,then ________ minutes.
Free
(Multiple Choice)
4.9/5 (37)
Correct Answer:Verified
C
Complete the following table in preparation for a Monte Carlo simulation.The expected demand is 3.52.
Free
(Essay)
4.9/5 (40)
Correct Answer:Verified
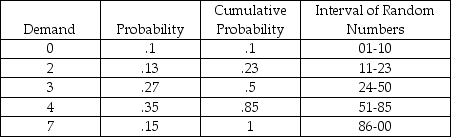 Students should have only moderate difficulty filling in the table,save for the demand column.To do this they must set up the equation for the expected demand and solve for the missing component.
.13(2)+ .27(3)+ .35(4)+ .15(X)= 3.52 so X = 7
The Las Vegas method is a simulation technique that uses random elements when chance exists in their behavior.
(True/False)
4.8/5 (30)
From a portion of a probability distribution,you read that P(demand = 0)is 0.25,and P(demand = 1)is 0.30.What are the random number intervals for this distribution beginning with 01?
(Multiple Choice)
4.7/5 (26)
Simulation may be capable of producing a more appropriate answer to a complex problem than can be obtained from a mathematical model.
(True/False)
4.8/5 (39)
Results of simulation experiments with large numbers of trials or long experimental runs will generally be better than those with fewer trials or shorter experimental runs.
(True/False)
4.8/5 (34)
Explain what is meant by the statement: "simulation is not limited to using the standard probability distributions."
(Essay)
4.9/5 (36)
Sam's hardware store has an order policy of ordering 12 gallons of a specific primer whenever 7 gallons are on hand (unless there's already an ordered delivery due).The store would like to see how well their policy works.Assume that beginning inventory in period 1 is 10 gallons and that orders are placed at the end of the week to be received one week later.(In other words,if an order is placed at the end of week one,it is available at the beginning of week 3. )Assume that if inventory is not on hand,it will result in a lost sale.The weekly demand distribution obtained from past sales is found in the table below.Also,use the random numbers that are provided and simulate 10 weeks' worth of sales.How many sales are lost?
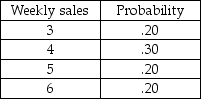 Random numbers for sales: 37,60,79,21,85,71,48,39,31,35
(Essay)
4.8/5 (28)
One reason for using simulation rather than an analytical model in an inventory problem is that the simulation is able to handle probabilistic demand and lead times.
(True/False)
4.8/5 (32)
Provide a small example illustrating how random numbers are used in Monte Carlo simulation.
(Essay)
4.9/5 (34)
The numbers used to represent each possible value or outcome in a computer simulation are referred to as ________.
(Essay)
4.8/5 (29)
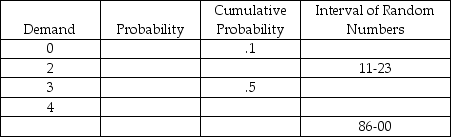
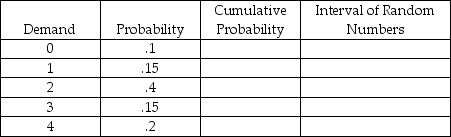
Complete the following table in preparation for a Monte Carlo simulation.
(Essay)
4.7/5 (42)
Setting up a probability distribution,building a cumulative probability distribution,and generating random numbers are:
(Multiple Choice)
4.8/5 (32)
The effects of operations management policies over many months or years can be obtained by computer simulation in a short time.What is this phenomenon called?
(Multiple Choice)
4.8/5 (39)
Explain the difference between random numbers and random number intervals.
(Essay)
4.9/5 (32)
Julie's Diamond Boutique is very concerned with its order policies related to one-carat diamond solitaires.Their current policy is to order 10 diamonds whenever their inventory reaches 6 diamonds (unless there is already an ordered delivery due).Currently there are 8 diamonds on hand.Orders are placed at the end of the month and take one month to arrive .The following distribution of monthly sales has been developed using historical sales.If Julie's Diamond Boutique does not have a diamond on hand,it will result in a lost sale.Use the following random numbers to determine the number of lost sales of one-carat solitaires at the store over 12 months.
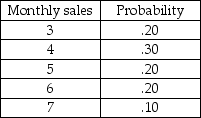 Random numbers for sales: 10,24,03,32,23,59,95,34,34,51,08,48
(Essay)
4.9/5 (41)
Filters
- Essay(0)
- Multiple Choice(0)
- Short Answer(0)
- True False(0)
- Matching(0)