Exam 2: Presenting Data in Tables and Charts
Exam 1: Instruction and Data Collection47 Questions
Exam 2: Presenting Data in Tables and Charts277 Questions
Exam 3: Numerical Descriptive Measures139 Questions
Exam 4: Basic Probability137 Questions
Exam 5: Some Important Discrete Probability Distributions188 Questions
Exam 6: The Normal Distribution and Other Continuous Distributions164 Questions
Exam 7: Sampling and Sampling Distributions187 Questions
Exam 8: Confidence Interval Estimation173 Questions
Exam 9: Fundamentals of Hypothesis Testing: One-Sample Tests146 Questions
Exam 10: Two-Sample Tests190 Questions
Exam 11: Analysis of Variance127 Questions
Exam 12: Chi-Square Tests and Nonparametric Tests174 Questions
Exam 13: Simple Linear Regression198 Questions
Exam 14: Introduction to Multiple Regression215 Questions
Exam 15: Multiple Regression Model Building101 Questions
Exam 16: Time-Series Analysis and Index Numbers133 Questions
Exam 17: Statistical Applications in Quality Management132 Questions
Exam 18: Data Analysis Overview52 Questions
Select questions type
TABLE 2-15
The table below contains the number of people who own a portable DVD player in a sample of 600 broken down by gender.
 -Referring to Table 2-15, construct a table of total percentages.
(Essay)
4.9/5  (35)
(35)
Whether the university is private or public is an example of a categorical variable.
(True/False)
4.8/5 (27)
TABLE 2-14
Given below is the stem-and-leaf display representing the amount of detergent used in gallons (with leaves in 10ths of gallons) in a month by 25 drive-through car wash operations in Phoenix.
 -Referring to Table 2-14, construct a relative frequency or percentage distribution for the detergent data, using "9.0 but less than 10.0" as the first class.
(Essay)
4.7/5 (35)
In constructing a polygon, each class grouping is represented by its ________ and then these are consecutively connected to one another.
(Short Answer)
4.7/5 (32)
A study attempted to estimate the proportion of Florida residents who were willing to spend more tax dollars on protecting the beaches from environmental disasters. Twenty-five hundred Florida residents were surveyed. What type of data collection procedure was most likely used to collect the data for this study?
(Multiple Choice)
4.9/5 (34)
TABLE 2-15
The table below contains the number of people who own a portable DVD player in a sample of 600 broken down by gender.
-Referring to Table 2-15, ________ percent of the 600 were males who did not own a portable DVD.
(Short Answer)
4.8/5 (34)
You have collected information on the consumption by the 15 largest coffee-consuming nations. Which of the following is the best for presenting the shares of the consumption?
(Multiple Choice)
4.8/5 (32)
Tim was planning for a meeting with his boss to discuss a raise in his annual salary. In preparation, he wanted to use the Consumer Price Index to determine the percentage increase in his real (inflation-adjusted) salary over the last three years. Which of the 4 methods of data collection was involved when he used the Consumer Price Index?
(Multiple Choice)
4.8/5 (28)
You have collected information on the market share of 5 different search engines used by U.S. Internet users in May 2007. Which of the following is the best for presenting the information?
(Multiple Choice)
4.8/5 (29)
TABLE 2-11
The histogram below represents scores achieved by 200 job applicants on a personality profile.
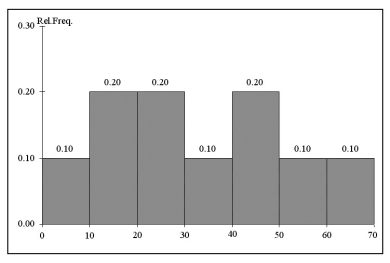 -Referring to the histogram from Table 2-11, the number of job applicants who scored between 30 and 60 is ________.
(Short Answer)
4.8/5 (33)
The Dean of Students conducted a survey on campus. The gender of the student is an example of a ________ variable.
(Short Answer)
4.8/5 (36)
The amount of alcohol consumed by a person per week is an example of a continuous variable.
(True/False)
4.8/5 (40)
TABLE 2-15
The table below contains the number of people who own a portable DVD player in a sample of 600 broken down by gender.
-Referring to Table 2-15, if the sample is a good representation of the population, we can expect ________ percent of the population will be males.
(Short Answer)
4.7/5 (36)
Relationships in a contingency table can be examined more fully if the frequencies are converted into ________.
(Short Answer)
4.8/5 (28)
TABLE 2-12
The ordered array below resulted from taking a sample of 25 batches of 500 computer chips and determining how many in each batch were defective.
Defects
 -Referring to Table 2-12, construct a relative frequency or percentage distribution for the defects data, using "0 but less than 5" as the first class.
(Essay)
4.8/5 (36)
Apple Computer, Inc. collected information on the age of their customers. The youngest customer was 12 and the oldest was 72. To study the distribution of the age among its customers, it can use a percentage polygon.
(True/False)
4.7/5 (37)
TABLE 2-4
Every spring semester, the School of Business coordinates with local business leaders a luncheon for graduating seniors, their families, and friends. Corporate sponsorship pays for the lunches of each of the seniors, but students have to purchase tickets to cover the cost of lunches served to guests they bring with them. The following histogram represents the attendance at the senior luncheon, where X is the number of guests each graduating senior invited to the luncheon and f is the number of graduating seniors in each category.
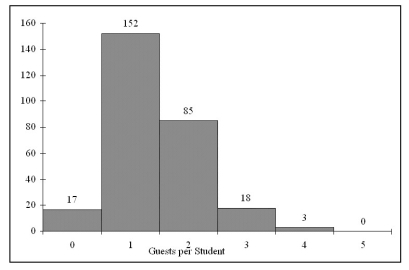 -Referring to the histogram from Table 2-4, how many graduating seniors attended the luncheon?
(Multiple Choice)
4.8/5 (33)
TABLE 2-13
The table below contains the opinions of a sample of 200 people broken down by gender about the latest congressional plan to eliminate anti-trust exemptions for professional baseball.
 -Referring to Table 2-13, of the females in the sample, ________ percent were against the plan.
(Short Answer)
4.8/5 (29)
Filters
- Essay(0)
- Multiple Choice(0)
- Short Answer(0)
- True False(0)
- Matching(0)