Exam 2: Presenting Data in Tables and Charts
Exam 1: Instruction and Data Collection47 Questions
Exam 2: Presenting Data in Tables and Charts277 Questions
Exam 3: Numerical Descriptive Measures139 Questions
Exam 4: Basic Probability137 Questions
Exam 5: Some Important Discrete Probability Distributions188 Questions
Exam 6: The Normal Distribution and Other Continuous Distributions164 Questions
Exam 7: Sampling and Sampling Distributions187 Questions
Exam 8: Confidence Interval Estimation173 Questions
Exam 9: Fundamentals of Hypothesis Testing: One-Sample Tests146 Questions
Exam 10: Two-Sample Tests190 Questions
Exam 11: Analysis of Variance127 Questions
Exam 12: Chi-Square Tests and Nonparametric Tests174 Questions
Exam 13: Simple Linear Regression198 Questions
Exam 14: Introduction to Multiple Regression215 Questions
Exam 15: Multiple Regression Model Building101 Questions
Exam 16: Time-Series Analysis and Index Numbers133 Questions
Exam 17: Statistical Applications in Quality Management132 Questions
Exam 18: Data Analysis Overview52 Questions
Select questions type
The stem-and-leaf display is often superior to the frequency distribution in that it maintains the original values for further analysis.
(True/False)
4.8/5  (28)
(28)
TABLE 2-15
The table below contains the number of people who own a portable DVD player in a sample of 600 broken down by gender.
 -Referring to Table 2-15, if the sample is a good representation of the population, we can expect ________ percent of the population will own a portable DVD.
(Short Answer)
4.8/5 (28)
TABLE 2-6
The following are the durations in minutes of a sample of long-distance phone calls made within the continental United States reported by one long-distance carrier.
 -Referring to Table 2-6, what is the width of each class?
(Multiple Choice)
4.8/5 (37)
TABLE 2-13
The table below contains the opinions of a sample of 200 people broken down by gender about the latest congressional plan to eliminate anti-trust exemptions for professional baseball.
 -Referring to Table 2-13, ________ percent of the 200 were males who were not against the plan.
(Short Answer)
4.8/5 (37)
TABLE 2-13
The table below contains the opinions of a sample of 200 people broken down by gender about the latest congressional plan to eliminate anti-trust exemptions for professional baseball.
-Referring to Table 2-13, if the sample is a good representation of the population, we can expect ________ percent of the population will be males.
(Short Answer)
4.9/5 (38)
TABLE 2-6
The following are the durations in minutes of a sample of long-distance phone calls made within the continental United States reported by one long-distance carrier.
-Referring to Table 2-6, if 100 calls were sampled, ________ of them would have lasted less than 5 minutes or at least 30 minutes or more.
(Multiple Choice)
4.9/5 (32)
TABLE 2-1
The manager of the customer service division of a major consumer electronics company is interested in determining whether the customers who have purchased a DVD player made by the company over the past 12 months are satisfied with their products.
-Referring to Table 2-1, the possible responses to the question "What brand of DVD player did you purchase?" result in
(Multiple Choice)
5.0/5 (34)
TABLE 2-1
The manager of the customer service division of a major consumer electronics company is interested in determining whether the customers who have purchased a DVD player made by the company over the past 12 months are satisfied with their products.
-Referring to Table 2-1, the possible responses to the question "How would you rate the quality of your purchase experience with 1 = excellent, 2 = good, 3 = decent, 4 = poor, 5 = terrible?" are values from a
(Multiple Choice)
4.9/5 (39)
TABLE 2-15
The table below contains the number of people who own a portable DVD player in a sample of 600 broken down by gender.
-Referring to Table 2-15, of those who owned a portable DVD in the sample, ________ percent were females.
(Short Answer)
4.8/5 (28)
TABLE 2-14
Given below is the stem-and-leaf display representing the amount of detergent used in gallons (with leaves in 10ths of gallons) in a month by 25 drive-through car wash operations in Phoenix.
 -Referring to Table 2-14, construct a percentage histogram for the detergent data, using "9.0 but less than 10.0" as the first class.
(Essay)
4.9/5 (36)
TABLE 2-13
The table below contains the opinions of a sample of 200 people broken down by gender about the latest congressional plan to eliminate anti-trust exemptions for professional baseball.
-Referring to Table 2-13, ________ percent of the 200 were against the plan.
(Short Answer)
4.8/5 (33)
TABLE 2-9
The Stem-and-Leaf display represents the number of times in a year that a random sample of 100 "lifetime" members of a health club actually visited the facility.
 -Referring to Table 2-9, if a frequency distribution with equal sized classes was made from this data, and the first class was "0 but less than 10," the relative frequency of the last class would be ________.
(Short Answer)
4.8/5 (40)
TABLE 2-14
Given below is the stem-and-leaf display representing the amount of detergent used in gallons (with leaves in 10ths of gallons) in a month by 25 drive-through car wash operations in Phoenix.
-Referring to Table 2-14, construct a percentage polygon for the detergent data if the corresponding frequency distribution uses "9.0 but less than 10.0" as the first class.
(Essay)
4.7/5 (42)
A personal computer user survey was conducted. Hours of personal computer use per week is an example of a ________ numerical variable.
(Short Answer)
4.8/5 (30)
TABLE 2-16
The figure below is the ogive for the amount of fat (in grams) for a sample of 36 pizza products where the upper boundaries of the intervals are: 5, 10, 15, 20, 25, and 30.
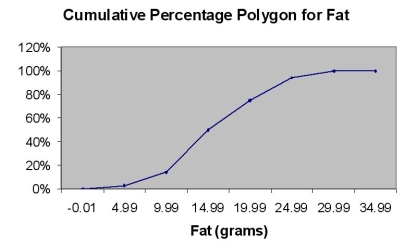 -Referring to Table 2-16, what percentage of pizza products contains between 10 and 25 grams of fat?
(Multiple Choice)
4.9/5 (34)
In graphing bivariate categorical data, the side-by-side bar chart is best suited when primary interest is in demonstrating differences in magnitude rather than differences in percentages.
(True/False)
4.9/5 (40)
The Dean of Students conducted a survey on campus. Class designation (Freshman, Sophomore, Junior, Senior) is an example of a ________ variable.
(Short Answer)
4.8/5 (33)
TABLE 2-9
The Stem-and-Leaf display represents the number of times in a year that a random sample of 100 "lifetime" members of a health club actually visited the facility.
-Referring to Table 2-9, ________ of the 100 members visited the health club no more than 12 times in a year.
(Short Answer)
4.8/5 (33)
TABLE 2-13
The table below contains the opinions of a sample of 200 people broken down by gender about the latest congressional plan to eliminate anti-trust exemptions for professional baseball.
-Referring to Table 2-13, if the sample is a good representation of the population, we can expect ________ percent of the females in the population will not be against the plan.
(Short Answer)
4.7/5 (31)
TABLE 2-7
A sample of 200 students at a Big-Ten university was taken after the midterm to ask them whether they went bar hopping the weekend before the midterm or spent the weekend studying, and whether they did well or poorly on the midterm. The following table contains the result.
 -Referring to Table 2-7, if the sample is a good representation of the population, we can expect ________ percent of the students in the population to spend the weekend studying and do poorly on the midterm.
(Multiple Choice)
4.8/5 (38)
Filters
- Essay(0)
- Multiple Choice(0)
- Short Answer(0)
- True False(0)
- Matching(0)