Exam 2: Presenting Data in Tables and Charts
Exam 1: Instruction and Data Collection47 Questions
Exam 2: Presenting Data in Tables and Charts277 Questions
Exam 3: Numerical Descriptive Measures139 Questions
Exam 4: Basic Probability137 Questions
Exam 5: Some Important Discrete Probability Distributions188 Questions
Exam 6: The Normal Distribution and Other Continuous Distributions164 Questions
Exam 7: Sampling and Sampling Distributions187 Questions
Exam 8: Confidence Interval Estimation173 Questions
Exam 9: Fundamentals of Hypothesis Testing: One-Sample Tests146 Questions
Exam 10: Two-Sample Tests190 Questions
Exam 11: Analysis of Variance127 Questions
Exam 12: Chi-Square Tests and Nonparametric Tests174 Questions
Exam 13: Simple Linear Regression198 Questions
Exam 14: Introduction to Multiple Regression215 Questions
Exam 15: Multiple Regression Model Building101 Questions
Exam 16: Time-Series Analysis and Index Numbers133 Questions
Exam 17: Statistical Applications in Quality Management132 Questions
Exam 18: Data Analysis Overview52 Questions
Select questions type
TABLE 2-13
The table below contains the opinions of a sample of 200 people broken down by gender about the latest congressional plan to eliminate anti-trust exemptions for professional baseball.
 -Referring to Table 2-13, if the sample is a good representation of the population, we can expect ________ percent of the males in the population will be against the plan.
(Short Answer)
4.9/5  (27)
(27)
TABLE 2-18
The following table presents total retail sales in millions of dollars for the leading apparel companies during April 2008 and April 2009.
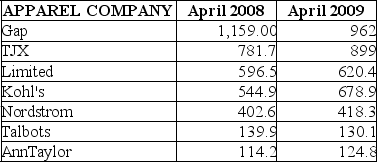 -Referring to Table 2-18, among the 8 stores, ________ saw a sales decline.
(Short Answer)
4.7/5 (30)
TABLE 2-8
The Stem-and-Leaf display below contains data on the number of months between the date a civil suit is filed and when the case is actually adjudicated for 50 cases heard in superior court.
 Note: 1L means the "low teens" - 10, 11, 12, 13, or 14; 1H means the "high teens" - 15, 16, 17, 18, or 19; 2L means the "low twenties" - 20, 21, 22, 23, or 24, etc.
-Referring to Table 2-8, the civil suit with the longest wait between when the suit was filed and when it was adjudicated had a wait of ________ months.
Note: 1L means the "low teens" - 10, 11, 12, 13, or 14; 1H means the "high teens" - 15, 16, 17, 18, or 19; 2L means the "low twenties" - 20, 21, 22, 23, or 24, etc.
-Referring to Table 2-8, the civil suit with the longest wait between when the suit was filed and when it was adjudicated had a wait of ________ months.
(Short Answer)
4.9/5 (37)
TABLE 2-14
Given below is the stem-and-leaf display representing the amount of detergent used in gallons (with leaves in 10ths of gallons) in a month by 25 drive-through car wash operations in Phoenix.
 -Referring to Table 2-14, if a percentage histogram for the detergent data is constructed, using "9.0 but less than 10.0 gallons" as the first class, what percentage of drive-through car wash operations use less than 12 gallons of detergent in a month?
(Short Answer)
4.8/5 (41)
TABLE 2-11
The histogram below represents scores achieved by 200 job applicants on a personality profile.
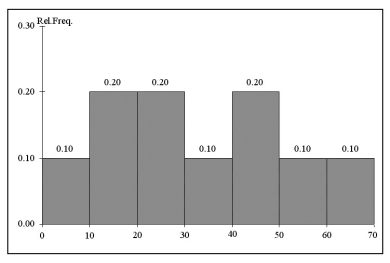 -Referring to the histogram from Table 2-11, the number of job applicants who scored 50 or above is ________.
(Short Answer)
4.9/5 (27)
TABLE 2-13
The table below contains the opinions of a sample of 200 people broken down by gender about the latest congressional plan to eliminate anti-trust exemptions for professional baseball.
-Referring to Table 2-13, if the sample is a good representation of the population, we can expect ________ percent of the population will be for the plan.
(Short Answer)
4.8/5 (36)
Researchers are concerned that the weight of the average American school child is increasing implying, among other things, that children's clothing should be manufactured and marketed in larger sizes. If X is the weight of school children sampled in a nationwide study, then X is an example of
(Multiple Choice)
4.7/5 (38)
When constructing a frequency distribution, classes should be selected in such a way that they are of equal width.
(True/False)
4.7/5 (40)
You have collected data on the annual average amount of cash rebate offered by 6 different brands of automobiles sold in the US in 2006 and in 2007. Which of the following is the best for presenting the data?
(Multiple Choice)
4.7/5 (35)
The date when a production line in a factory is out-of-control will be measured with a ratio scale.
(True/False)
4.7/5 (37)
A personal computer user survey was conducted. The number of computer magazine subscriptions is an example of a ________ numerical variable.
(Short Answer)
4.9/5 (28)
TABLE 2-14
Given below is the stem-and-leaf display representing the amount of detergent used in gallons (with leaves in 10ths of gallons) in a month by 25 drive-through car wash operations in Phoenix.
-Referring to Table 2-14, construct a cumulative percentage polygon for the detergent data if the corresponding frequency distribution uses "9.0 but less than 10.0" as the first class.
(Essay)
4.8/5 (45)
The original data values cannot be assessed once they are grouped into a frequency distribution table.
(True/False)
4.7/5 (45)
Data on 1,500 students' height were collected at a larger university in the East Coast. Which of the following is the best chart for presenting the information?
(Multiple Choice)
4.9/5 (38)
TABLE 2-9
The Stem-and-Leaf display represents the number of times in a year that a random sample of 100 "lifetime" members of a health club actually visited the facility.
 -Referring to Table 2-9, if a frequency distribution with equal sized classes was made from this data, and the first class was "0 but less than 10," the frequency of the fifth class would be ________.
(Short Answer)
4.9/5 (35)
TABLE 2-17
The figure below is the percentage polygon for the amount of calories for a sample of 36 pizzas products where the upper limits of the intervals are: 310, 340, 370, 400 and 430.
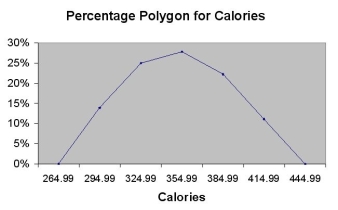 -Referring to Table 2-17, roughly what percentage of pizza products contains at least 340 calories?
(Multiple Choice)
4.8/5 (37)
To evaluate two categorical variables at the same time, a ________ could be developed.
(Short Answer)
4.8/5 (26)
The classification of student major (accounting, economics, management, marketing, other) is an example of
(Multiple Choice)
4.8/5 (34)
TABLE 2-15
The table below contains the number of people who own a portable DVD player in a sample of 600 broken down by gender.
 -Referring to Table 2-15, of the females in the sample, ________ percent owned a portable DVD.
(Short Answer)
4.8/5 (45)
Filters
- Essay(0)
- Multiple Choice(0)
- Short Answer(0)
- True False(0)
- Matching(0)