Exam 2: Presenting Data in Tables and Charts
Exam 1: Instruction and Data Collection47 Questions
Exam 2: Presenting Data in Tables and Charts277 Questions
Exam 3: Numerical Descriptive Measures139 Questions
Exam 4: Basic Probability137 Questions
Exam 5: Some Important Discrete Probability Distributions188 Questions
Exam 6: The Normal Distribution and Other Continuous Distributions164 Questions
Exam 7: Sampling and Sampling Distributions187 Questions
Exam 8: Confidence Interval Estimation173 Questions
Exam 9: Fundamentals of Hypothesis Testing: One-Sample Tests146 Questions
Exam 10: Two-Sample Tests190 Questions
Exam 11: Analysis of Variance127 Questions
Exam 12: Chi-Square Tests and Nonparametric Tests174 Questions
Exam 13: Simple Linear Regression198 Questions
Exam 14: Introduction to Multiple Regression215 Questions
Exam 15: Multiple Regression Model Building101 Questions
Exam 16: Time-Series Analysis and Index Numbers133 Questions
Exam 17: Statistical Applications in Quality Management132 Questions
Exam 18: Data Analysis Overview52 Questions
Select questions type
TABLE 2-1
The manager of the customer service division of a major consumer electronics company is interested in determining whether the customers who have purchased a DVD player made by the company over the past 12 months are satisfied with their products.
-Referring to Table 2-1, the possible responses to the question " Out of a 100 point score with 100 being the highest and 0 being the lowest, what is your satisfaction level on the DVD player that you purchased?" result in
(Multiple Choice)
4.9/5  (27)
(27)
TABLE 2-1
The manager of the customer service division of a major consumer electronics company is interested in determining whether the customers who have purchased a DVD player made by the company over the past 12 months are satisfied with their products.
-Referring to Table 2-1, the possible responses to the question "Are you happy, indifferent, or unhappy with the performance per dollar spent on the DVD player?" result in
(Multiple Choice)
4.8/5 (28)
TABLE 2-4
Every spring semester, the School of Business coordinates with local business leaders a luncheon for graduating seniors, their families, and friends. Corporate sponsorship pays for the lunches of each of the seniors, but students have to purchase tickets to cover the cost of lunches served to guests they bring with them. The following histogram represents the attendance at the senior luncheon, where X is the number of guests each graduating senior invited to the luncheon and f is the number of graduating seniors in each category.
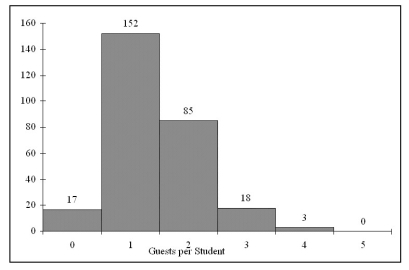 -When constructing charts, the following is plotted at the class midpoints:
(Multiple Choice)
5.0/5 (34)
TABLE 2-2
An insurance company evaluates many numerical variables about a person before deciding on an appropriate rate for automobile insurance. A representative from a local insurance agency selected a random sample of insured drivers and recorded, X, the number of claims each made in the last 3 years, with the following results.
 -Referring to Table 2-2, how many total claims are represented in the sample?
(Multiple Choice)
4.9/5 (27)
TABLE 2-18
The following table presents total retail sales in millions of dollars for the leading apparel companies during April 2008 and April 2009.
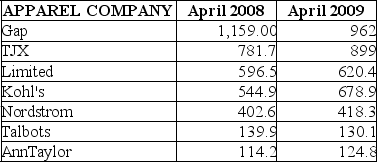 -Referring to Table 2-18, construct a table of column percentages.
(Essay)
4.7/5 (31)
Histograms are used for numerical data while bar charts are suitable for categorical data.
(True/False)
4.8/5 (39)
TABLE 2-16
The figure below is the ogive for the amount of fat (in grams) for a sample of 36 pizza products where the upper boundaries of the intervals are: 5, 10, 15, 20, 25, and 30.
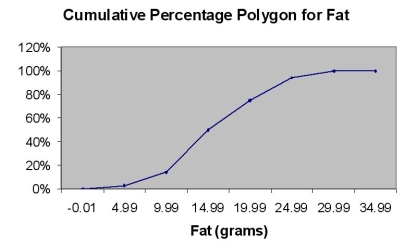 -Referring to Table 2-16, what percentage of pizza products contains at least 20 grams of fat?
(Multiple Choice)
4.7/5 (29)
An insurance company evaluates many numerical variables about a person before deciding on an appropriate rate for automobile insurance. The number of claims a person has made in the last 3 years is an example of a ________ numerical variable.
(Short Answer)
4.7/5 (33)
TABLE 2-17
The figure below is the percentage polygon for the amount of calories for a sample of 36 pizzas products where the upper limits of the intervals are: 310, 340, 370, 400 and 430.
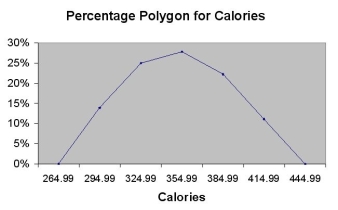 -Referring to Table 2-17, roughly what percentage of pizza products contains between 400 and 430 calories?
(Multiple Choice)
4.9/5 (42)
The number of defective apples in a single box is an example of a continuous variable.
(True/False)
4.7/5 (34)
TABLE 2-8
The Stem-and-Leaf display below contains data on the number of months between the date a civil suit is filed and when the case is actually adjudicated for 50 cases heard in superior court.
 Note: 1L means the "low teens" - 10, 11, 12, 13, or 14; 1H means the "high teens" - 15, 16, 17, 18, or 19; 2L means the "low twenties" - 20, 21, 22, 23, or 24, etc.
-Referring to Table 2-8, the civil suit with the fourth shortest waiting time between when the suit was filed and when it was adjudicated had a wait of ________ months.
Note: 1L means the "low teens" - 10, 11, 12, 13, or 14; 1H means the "high teens" - 15, 16, 17, 18, or 19; 2L means the "low twenties" - 20, 21, 22, 23, or 24, etc.
-Referring to Table 2-8, the civil suit with the fourth shortest waiting time between when the suit was filed and when it was adjudicated had a wait of ________ months.
(Short Answer)
4.9/5 (34)
TABLE 2-15
The table below contains the number of people who own a portable DVD player in a sample of 600 broken down by gender.
 -Referring to Table 2-15, ________ percent of the 600 were males who owned a portable DVD.
(Short Answer)
4.7/5 (39)
TABLE 2-6
The following are the durations in minutes of a sample of long-distance phone calls made within the continental United States reported by one long-distance carrier.
 -Referring to Table 2-6, what is the cumulative relative frequency for the percentage of calls that lasted 10 minutes or more?
(Multiple Choice)
4.8/5 (30)
TABLE 2-13
The table below contains the opinions of a sample of 200 people broken down by gender about the latest congressional plan to eliminate anti-trust exemptions for professional baseball.
 -Referring to Table 2-13, construct a table of row percentages.
(Essay)
4.9/5 (34)
TABLE 2-4
Every spring semester, the School of Business coordinates with local business leaders a luncheon for graduating seniors, their families, and friends. Corporate sponsorship pays for the lunches of each of the seniors, but students have to purchase tickets to cover the cost of lunches served to guests they bring with them. The following histogram represents the attendance at the senior luncheon, where X is the number of guests each graduating senior invited to the luncheon and f is the number of graduating seniors in each category.
-When polygons or histograms are constructed, which axis must show the true zero or "origin"?
(Multiple Choice)
4.8/5 (32)
TABLE 2-12
The ordered array below resulted from taking a sample of 25 batches of 500 computer chips and determining how many in each batch were defective.
Defects
 -Referring to Table 2-12, construct a cumulative percentage distribution for the defects data if the corresponding frequency distribution uses "0 but less than 5" as the first class.
(Essay)
4.8/5 (36)
TABLE 2-13
The table below contains the opinions of a sample of 200 people broken down by gender about the latest congressional plan to eliminate anti-trust exemptions for professional baseball.
-Referring to Table 2-13, ________ percent of the 200 were females who were against the plan.
(Short Answer)
4.9/5 (32)
A marketing research firm, in conducting a comparative taste test, provided three types of peanut butter to a sample of households randomly selected within the state. Which of the 4 methods of data collection is involved when people are asked to compare the three types of peanut butter?
(Multiple Choice)
4.8/5 (28)
The main principle behind the Pareto diagram is the ability to track the "vital few" from the "trivial many."
(True/False)
4.8/5 (28)
TABLE 2-8
The Stem-and-Leaf display below contains data on the number of months between the date a civil suit is filed and when the case is actually adjudicated for 50 cases heard in superior court.
Note: 1L means the "low teens" - 10, 11, 12, 13, or 14; 1H means the "high teens" - 15, 16, 17, 18, or 19; 2L means the "low twenties" - 20, 21, 22, 23, or 24, etc.
-Referring to Table 2-8, if a frequency distribution with equal sized classes was made from this data, and the first class was "10 but less than 20," the relative frequency of the third class would be ________.
(Short Answer)
5.0/5 (36)
Filters
- Essay(0)
- Multiple Choice(0)
- Short Answer(0)
- True False(0)
- Matching(0)