Exam 2: Presenting Data in Tables and Charts
Exam 1: Instruction and Data Collection47 Questions
Exam 2: Presenting Data in Tables and Charts277 Questions
Exam 3: Numerical Descriptive Measures139 Questions
Exam 4: Basic Probability137 Questions
Exam 5: Some Important Discrete Probability Distributions188 Questions
Exam 6: The Normal Distribution and Other Continuous Distributions164 Questions
Exam 7: Sampling and Sampling Distributions187 Questions
Exam 8: Confidence Interval Estimation173 Questions
Exam 9: Fundamentals of Hypothesis Testing: One-Sample Tests146 Questions
Exam 10: Two-Sample Tests190 Questions
Exam 11: Analysis of Variance127 Questions
Exam 12: Chi-Square Tests and Nonparametric Tests174 Questions
Exam 13: Simple Linear Regression198 Questions
Exam 14: Introduction to Multiple Regression215 Questions
Exam 15: Multiple Regression Model Building101 Questions
Exam 16: Time-Series Analysis and Index Numbers133 Questions
Exam 17: Statistical Applications in Quality Management132 Questions
Exam 18: Data Analysis Overview52 Questions
Select questions type
TABLE 2-8
The Stem-and-Leaf display below contains data on the number of months between the date a civil suit is filed and when the case is actually adjudicated for 50 cases heard in superior court.
 Note: 1L means the "low teens" - 10, 11, 12, 13, or 14; 1H means the "high teens" - 15, 16, 17, 18, or 19; 2L means the "low twenties" - 20, 21, 22, 23, or 24, etc.
-Referring to Table 2-8, if a frequency distribution with equal sized classes was made from this data, and the first class was "10 but less than 20," the cumulative percentage of the second class would be ________.
Note: 1L means the "low teens" - 10, 11, 12, 13, or 14; 1H means the "high teens" - 15, 16, 17, 18, or 19; 2L means the "low twenties" - 20, 21, 22, 23, or 24, etc.
-Referring to Table 2-8, if a frequency distribution with equal sized classes was made from this data, and the first class was "10 but less than 20," the cumulative percentage of the second class would be ________.
(Short Answer)
4.9/5  (31)
(31)
The grade level (K-12) of a student is an example of a nominal scaled variable.
(True/False)
4.9/5 (29)
TABLE 2-11
The histogram below represents scores achieved by 200 job applicants on a personality profile.
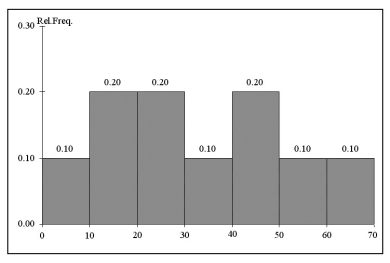 -Referring to the histogram from Table 2-11, ________ percent of the job applicants scored between 10 and 20.
(Short Answer)
4.7/5 (41)
TABLE 2-1
The manager of the customer service division of a major consumer electronics company is interested in determining whether the customers who have purchased a DVD player made by the company over the past 12 months are satisfied with their products.
-Referring to Table 2-1, the possible responses to the question "In which year were you born?" are values from a
(Multiple Choice)
4.7/5 (32)
The amount of coffee consumed by an individual in a day is an example of a discrete numerical variable.
(True/False)
4.9/5 (49)
TABLE 2-13
The table below contains the opinions of a sample of 200 people broken down by gender about the latest congressional plan to eliminate anti-trust exemptions for professional baseball.
 -Referring to Table 2-13, of those for the plan in the sample, ________ percent were females.
(Short Answer)
4.9/5 (37)
TABLE 2-13
The table below contains the opinions of a sample of 200 people broken down by gender about the latest congressional plan to eliminate anti-trust exemptions for professional baseball.
-Referring to Table 2-13, ________ percent of the 200 were not neutral.
(Short Answer)
4.8/5 (31)
TABLE 2-15
The table below contains the number of people who own a portable DVD player in a sample of 600 broken down by gender.
 -Referring to Table 2-15, ________ percent of the 600 were females who owned a portable DVD.
(Short Answer)
4.8/5 (34)
TABLE 2-1
The manager of the customer service division of a major consumer electronics company is interested in determining whether the customers who have purchased a DVD player made by the company over the past 12 months are satisfied with their products.
-Referring to Table 2-1, the possible responses to the question "How many people are there in your household?" result in
(Multiple Choice)
5.0/5 (45)
TABLE 2-11
The histogram below represents scores achieved by 200 job applicants on a personality profile.
-Referring to the histogram from Table 2-11, ________ percent of the applicants scored between 20 and 50.
(Short Answer)
4.8/5 (40)
TABLE 2-9
The Stem-and-Leaf display represents the number of times in a year that a random sample of 100 "lifetime" members of a health club actually visited the facility.
 -Referring to Table 2-9, the person who visited the health club less than anyone else in the sample visited the facility ________ times.
(Short Answer)
4.9/5 (36)
A continuous variable may take on any value within its relevant range even though the measurement device may not be precise enough to record it.
(True/False)
4.8/5 (27)
TABLE 2-17
The figure below is the percentage polygon for the amount of calories for a sample of 36 pizzas products where the upper limits of the intervals are: 310, 340, 370, 400 and 430.
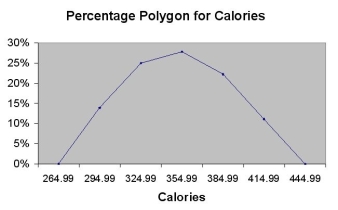 -Referring to Table 2-17, roughly what percentage of pizza products contains between 340 and 400 calories?
(Multiple Choice)
4.8/5 (31)
If the values of the seventh and eighth class in a cumulative frequency distribution are the same, we know that there are no observations in the eighth class.
(True/False)
4.8/5 (35)
TABLE 2-7
A sample of 200 students at a Big-Ten university was taken after the midterm to ask them whether they went bar hopping the weekend before the midterm or spent the weekend studying, and whether they did well or poorly on the midterm. The following table contains the result.
 -Referring to Table 2-7, if the sample is a good representation of the population, we can expect ________ percent of those who spent the weekend studying to do poorly on the midterm.
(Multiple Choice)
4.7/5 (38)
TABLE 2-13
The table below contains the opinions of a sample of 200 people broken down by gender about the latest congressional plan to eliminate anti-trust exemptions for professional baseball.
-Referring to Table 2-13, ________ percent of the 200 were males who were neutral.
(Short Answer)
4.9/5 (32)
Most colleges admit students based on their achievements in a number of different areas. Whether a student has taken any advanced placement courses is an example of a ________ variable.
(Short Answer)
4.7/5 (32)
A statistics student found a reference in the campus library that contained the median family incomes for all 50 states. She would report her data as being collected using
(Multiple Choice)
4.9/5 (31)
TABLE 2-13
The table below contains the opinions of a sample of 200 people broken down by gender about the latest congressional plan to eliminate anti-trust exemptions for professional baseball.
-Referring to Table 2-13, construct a table of column percentages.
(Essay)
4.9/5 (42)
Filters
- Essay(0)
- Multiple Choice(0)
- Short Answer(0)
- True False(0)
- Matching(0)