Exam 2: Presenting Data in Tables and Charts
Exam 1: Instruction and Data Collection47 Questions
Exam 2: Presenting Data in Tables and Charts277 Questions
Exam 3: Numerical Descriptive Measures139 Questions
Exam 4: Basic Probability137 Questions
Exam 5: Some Important Discrete Probability Distributions188 Questions
Exam 6: The Normal Distribution and Other Continuous Distributions164 Questions
Exam 7: Sampling and Sampling Distributions187 Questions
Exam 8: Confidence Interval Estimation173 Questions
Exam 9: Fundamentals of Hypothesis Testing: One-Sample Tests146 Questions
Exam 10: Two-Sample Tests190 Questions
Exam 11: Analysis of Variance127 Questions
Exam 12: Chi-Square Tests and Nonparametric Tests174 Questions
Exam 13: Simple Linear Regression198 Questions
Exam 14: Introduction to Multiple Regression215 Questions
Exam 15: Multiple Regression Model Building101 Questions
Exam 16: Time-Series Analysis and Index Numbers133 Questions
Exam 17: Statistical Applications in Quality Management132 Questions
Exam 18: Data Analysis Overview52 Questions
Select questions type
TABLE 2-18
The following table presents total retail sales in millions of dollars for the leading apparel companies during April 2008 and April 2009.
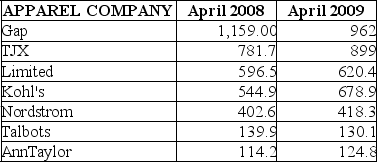 -Referring to Table 2-18, in general, retail sales for the apparel industry have seen a modest growth between April 2008 and April 2009.
(True/False)
4.7/5  (38)
(38)
You have collected data on the approximate retail price (in $) and the energy cost per year (in $) of 15 refrigerators. Which of the following is the best for presenting the data?
(Multiple Choice)
4.9/5 (45)
TABLE 2-1
The manager of the customer service division of a major consumer electronics company is interested in determining whether the customers who have purchased a DVD player made by the company over the past 12 months are satisfied with their products.
-Referring to Table 2-1, the possible responses to the question "How many people are there in your household?" are values from a
(Multiple Choice)
4.9/5 (38)
To determine the width of class interval, divide the number of class groups by the range of the data.
(True/False)
4.8/5 (35)
TABLE 2-10
The frequency distribution below represents the rents of 250 randomly selected federally subsidized apartments in Minneapolis.
 -Referring to Table 2-10, the relative frequency of the second class is ________.
(Short Answer)
4.9/5 (41)
The percentage polygon is formed by having the lower boundary of each class represent the data in that class and then connecting the sequence of lower boundaries at their respective class percentages.
(True/False)
4.9/5 (38)
TABLE 2-15
The table below contains the number of people who own a portable DVD player in a sample of 600 broken down by gender.
 -Referring to Table 2-15, of the males in the sample, ________ percent owned a portable DVD.
(Short Answer)
4.8/5 (36)
In purchasing an automobile, there are a number of variables to consider. The color of the car is an example of a ________ variable.
(Short Answer)
4.8/5 (33)
The level of satisfaction ("Very unsatisfied", "Fairly unsatisfied", "Fairly satisfied", and "Very satisfied") in a class is an example of a categorical variable.
(True/False)
5.0/5 (33)
TABLE 2-16
The figure below is the ogive for the amount of fat (in grams) for a sample of 36 pizza products where the upper boundaries of the intervals are: 5, 10, 15, 20, 25, and 30.
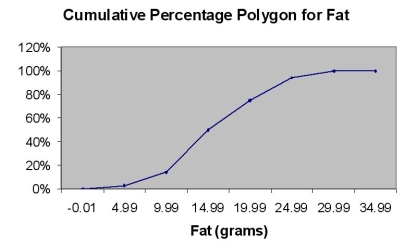 -Referring to Table 2-16, roughly what percentage of pizza products contains less than 10 grams of fat?
(Multiple Choice)
4.7/5 (31)
A Wal-Mart store in a small town monitors customer complaints and organizes these complaints into six distinct categories. Over the past year, the company has received 534 complaints. One possible graphical method for representing these data would be a Pareto chart.
(True/False)
4.7/5 (25)
TABLE 2-12
The ordered array below resulted from taking a sample of 25 batches of 500 computer chips and determining how many in each batch were defective.
Defects
 -Referring to Table 2-12, if a frequency distribution for the defects data is constructed, using "0 but less than 5" as the first class, the frequency of the "20 but less than 25" class would be ________.
(Short Answer)
4.7/5 (32)
Most colleges admit students based on their achievements in a number of different areas. The total SAT score achieved by a student is an example of a ________ numerical variable.
(Short Answer)
4.9/5 (26)
TABLE 2-2
An insurance company evaluates many numerical variables about a person before deciding on an appropriate rate for automobile insurance. A representative from a local insurance agency selected a random sample of insured drivers and recorded, X, the number of claims each made in the last 3 years, with the following results.
 -Referring to Table 2-2, how many drivers are represented in the sample?
(Multiple Choice)
4.8/5 (44)
An insurance company evaluates many numerical variables about a person before deciding on an appropriate rate for automobile insurance. The number of tickets a person has received in the last 3 years is an example of a ________ numerical variable.
(Short Answer)
4.7/5 (36)
Which of the 4 methods of data collection is involved when a person counts the number of cars passing designated locations on the Los Angeles freeway system?
(Multiple Choice)
4.9/5 (27)
TABLE 2-1
The manager of the customer service division of a major consumer electronics company is interested in determining whether the customers who have purchased a DVD player made by the company over the past 12 months are satisfied with their products.
-Referring to Table 2-1, the possible responses to the question "What brand of DVD player did you purchase?" are values from a
(Multiple Choice)
4.9/5 (34)
TABLE 2-1
The manager of the customer service division of a major consumer electronics company is interested in determining whether the customers who have purchased a DVD player made by the company over the past 12 months are satisfied with their products.
-Referring to Table 2-1, the possible responses to the question "What is your annual income rounded to the nearest thousands?" are values from a
(Multiple Choice)
5.0/5 (24)
The percentage distribution cannot be constructed from the frequency distribution directly.
(True/False)
4.9/5 (40)
TABLE 2-14
Given below is the stem-and-leaf display representing the amount of detergent used in gallons (with leaves in 10ths of gallons) in a month by 25 drive-through car wash operations in Phoenix.
 -Referring to Table 2-14, if a relative frequency or percentage distribution for the detergent data is constructed, using "9.0 but less than 10.0 gallons" as the first class, what percentage of drive-through car wash operations use at least 10 gallons of detergent in a month?
(Short Answer)
4.9/5 (44)
Filters
- Essay(0)
- Multiple Choice(0)
- Short Answer(0)
- True False(0)
- Matching(0)