Exam 2: Presenting Data in Tables and Charts
Exam 1: Instruction and Data Collection47 Questions
Exam 2: Presenting Data in Tables and Charts277 Questions
Exam 3: Numerical Descriptive Measures139 Questions
Exam 4: Basic Probability137 Questions
Exam 5: Some Important Discrete Probability Distributions188 Questions
Exam 6: The Normal Distribution and Other Continuous Distributions164 Questions
Exam 7: Sampling and Sampling Distributions187 Questions
Exam 8: Confidence Interval Estimation173 Questions
Exam 9: Fundamentals of Hypothesis Testing: One-Sample Tests146 Questions
Exam 10: Two-Sample Tests190 Questions
Exam 11: Analysis of Variance127 Questions
Exam 12: Chi-Square Tests and Nonparametric Tests174 Questions
Exam 13: Simple Linear Regression198 Questions
Exam 14: Introduction to Multiple Regression215 Questions
Exam 15: Multiple Regression Model Building101 Questions
Exam 16: Time-Series Analysis and Index Numbers133 Questions
Exam 17: Statistical Applications in Quality Management132 Questions
Exam 18: Data Analysis Overview52 Questions
Select questions type
TABLE 2-11
The histogram below represents scores achieved by 200 job applicants on a personality profile.
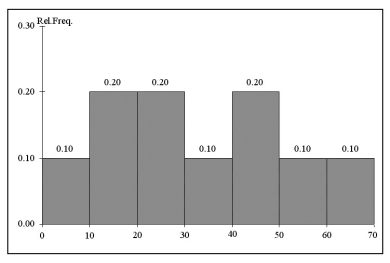 -Referring to the histogram from Table 2-11, 90% of the job applicants scored above or equal to ________.
(Short Answer)
4.7/5  (34)
(34)
The answer to the question "What is your sleeping bag temperature rating?" is an example of a ratio scaled variable.
(True/False)
4.8/5 (31)
TABLE 2-10
The frequency distribution below represents the rents of 250 randomly selected federally subsidized apartments in Minneapolis.
 -Referring to Table 2-10, ________ percent of the apartments rented for at least $500.
(Short Answer)
4.9/5 (33)
TABLE 2-10
The frequency distribution below represents the rents of 250 randomly selected federally subsidized apartments in Minneapolis.
-Referring to Table 2-10, the class midpoint of the second class is ________.
(Short Answer)
4.9/5 (35)
Data on the number of credit hours of 20,000 students at a public university enrolled in a Spring semester were collected. Which of the following is the best for presenting the information?
(Multiple Choice)
4.8/5 (42)
The personnel director at a large company studied the eating habits of the company's employees. The director noted whether employees brought their own lunches to work, ate at the company cafeteria, or went out to lunch. The goal of the study was to improve the food service at the company cafeteria. This type of data collection would best be considered as
(Multiple Choice)
4.9/5 (34)
TABLE 2-14
Given below is the stem-and-leaf display representing the amount of detergent used in gallons (with leaves in 10ths of gallons) in a month by 25 drive-through car wash operations in Phoenix.
 -Referring to Table 2-14, if a frequency distribution for the amount of detergent used is constructed, using "9.0 but less than 10.0 gallons" as the first class, the frequency of the "11.0 but less than 12.0 gallons" class would be ________.
(Short Answer)
4.9/5 (38)
TABLE 2-8
The Stem-and-Leaf display below contains data on the number of months between the date a civil suit is filed and when the case is actually adjudicated for 50 cases heard in superior court.
 Note: 1L means the "low teens" - 10, 11, 12, 13, or 14; 1H means the "high teens" - 15, 16, 17, 18, or 19; 2L means the "low twenties" - 20, 21, 22, 23, or 24, etc.
-Referring to Table 2-8, if a frequency distribution with equal sized classes was made from this data, and the first class was "10 but less than 20," the frequency of that class would be ________.
Note: 1L means the "low teens" - 10, 11, 12, 13, or 14; 1H means the "high teens" - 15, 16, 17, 18, or 19; 2L means the "low twenties" - 20, 21, 22, 23, or 24, etc.
-Referring to Table 2-8, if a frequency distribution with equal sized classes was made from this data, and the first class was "10 but less than 20," the frequency of that class would be ________.
(Short Answer)
4.9/5 (41)
The chancellor of a major university was concerned about alcohol abuse on her campus and wanted to find out the proportion of students at her university who visited campus bars on the weekend before the final exam week. Her assistant took a random sample of 250 students. The total number of students in the sample who visited campus bars on the weekend before the final exam week is an example of
(Multiple Choice)
4.8/5 (39)
TABLE 2-14
Given below is the stem-and-leaf display representing the amount of detergent used in gallons (with leaves in 10ths of gallons) in a month by 25 drive-through car wash operations in Phoenix.
-Referring to Table 2-14, construct a frequency distribution for the detergent data, using "9.0 but less than 10.0 gallons" as the first class.
(Essay)
4.8/5 (31)
A histogram can have gaps between the bars, whereas bar charts cannot have gaps.
(True/False)
4.9/5 (35)
Most colleges admit students based on their achievements in a number of different areas. The grade obtained in senior level English. (A, B, C, D, or
F) is an example of a ________ variable.
(Short Answer)
4.7/5 (40)
The classification of student class designation (freshman, sophomore, junior, senior) is an example of
(Multiple Choice)
4.9/5 (27)
TABLE 2-3
At a meeting of information systems officers for regional offices of a national company, a survey was taken to determine the number of employees the officers supervise in the operation of their departments, where X is the number of employees overseen by each information systems officer.
 -Referring to Table 2-3, across all of the regional offices, how many total employees were supervised by those surveyed?
(Multiple Choice)
4.8/5 (26)
TABLE 2-11
The histogram below represents scores achieved by 200 job applicants on a personality profile.
-Referring to the histogram from Table 2-11, ________ percent of the applicants scored below 20 or at least 50.
(Short Answer)
4.8/5 (39)
Apple Computer, Inc. collected information on the age of their customers. The youngest customer was 12 and the oldest was 72. To study the distribution of the age among its customers, it can use a Pareto chart.
(True/False)
4.8/5 (27)
The point halfway between the boundaries of each class interval in a grouped frequency distribution is called the ________.
(Short Answer)
4.9/5 (35)
The amount of calories contained in a pack of 12-ounce cheese is an example of a discrete variable.
(True/False)
4.9/5 (35)
TABLE 2-1
The manager of the customer service division of a major consumer electronics company is interested in determining whether the customers who have purchased a DVD player made by the company over the past 12 months are satisfied with their products.
-Referring to Table 2-1, the possible responses to the question "How many DVD players made by other manufacturers have you used?" result in
(Multiple Choice)
4.9/5 (37)
TABLE 2-6
The following are the durations in minutes of a sample of long-distance phone calls made within the continental United States reported by one long-distance carrier.
 -Referring to Table 2-6, if 100 calls were randomly sampled, ________ of them would have lasted at least 15 minutes but less than 20 minutes.
(Multiple Choice)
4.9/5 (27)
Filters
- Essay(0)
- Multiple Choice(0)
- Short Answer(0)
- True False(0)
- Matching(0)