Exam 2: Presenting Data in Tables and Charts
Exam 1: Instruction and Data Collection47 Questions
Exam 2: Presenting Data in Tables and Charts277 Questions
Exam 3: Numerical Descriptive Measures139 Questions
Exam 4: Basic Probability137 Questions
Exam 5: Some Important Discrete Probability Distributions188 Questions
Exam 6: The Normal Distribution and Other Continuous Distributions164 Questions
Exam 7: Sampling and Sampling Distributions187 Questions
Exam 8: Confidence Interval Estimation173 Questions
Exam 9: Fundamentals of Hypothesis Testing: One-Sample Tests146 Questions
Exam 10: Two-Sample Tests190 Questions
Exam 11: Analysis of Variance127 Questions
Exam 12: Chi-Square Tests and Nonparametric Tests174 Questions
Exam 13: Simple Linear Regression198 Questions
Exam 14: Introduction to Multiple Regression215 Questions
Exam 15: Multiple Regression Model Building101 Questions
Exam 16: Time-Series Analysis and Index Numbers133 Questions
Exam 17: Statistical Applications in Quality Management132 Questions
Exam 18: Data Analysis Overview52 Questions
Select questions type
Student grades (A to
F) are an example of continuous numerical data.
(True/False)
4.7/5  (38)
(38)
TABLE 2-11
The histogram below represents scores achieved by 200 job applicants on a personality profile.
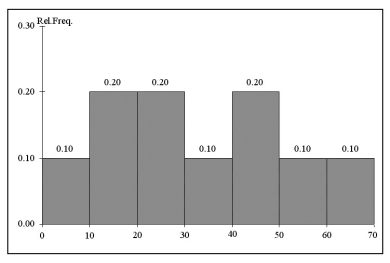 -Referring to the histogram from Table 2-11, half of the job applicants scored below ________.
(Short Answer)
4.9/5 (37)
TABLE 2-15
The table below contains the number of people who own a portable DVD player in a sample of 600 broken down by gender.
 -Referring to Table 2-15, of those who did not own a portable DVD in the sample, ________ percent were males.
(Short Answer)
4.9/5 (34)
The sum of relative frequencies in a distribution always equals 1.
(True/False)
4.9/5 (37)
TABLE 2-15
The table below contains the number of people who own a portable DVD player in a sample of 600 broken down by gender.
-Referring to Table 2-15, if the sample is a good representation of the population, we can expect ________ percent of the females in the population will not own a portable DVD.
(Short Answer)
4.8/5 (39)
The Dean of Students conducted a survey on campus. Average SAT score in mathematics is an example of a ________ numerical variable.
(Short Answer)
4.8/5 (43)
TABLE 2-10
The frequency distribution below represents the rents of 250 randomly selected federally subsidized apartments in Minneapolis.
 -Referring to Table 2-10, ________ percent of the apartments rented for no less than $600.
(Short Answer)
4.7/5 (25)
TABLE 2-15
The table below contains the number of people who own a portable DVD player in a sample of 600 broken down by gender.
-Referring to Table 2-15, of the females in the sample, ________ percent did not own a portable DVD.
(Short Answer)
4.9/5 (33)
TABLE 2-3
At a meeting of information systems officers for regional offices of a national company, a survey was taken to determine the number of employees the officers supervise in the operation of their departments, where X is the number of employees overseen by each information systems officer.
 -The width of each bar in a histogram corresponds to the
(Multiple Choice)
4.9/5 (40)
TABLE 2-15
The table below contains the number of people who own a portable DVD player in a sample of 600 broken down by gender.
-Referring to Table 2-15, ________ percent of the 600 owned a portable DVD.
(Short Answer)
4.9/5 (41)
TABLE 2-13
The table below contains the opinions of a sample of 200 people broken down by gender about the latest congressional plan to eliminate anti-trust exemptions for professional baseball.
 -Referring to Table 2-13, construct a table of total percentages.
(Essay)
4.9/5 (43)
TABLE 2-13
The table below contains the opinions of a sample of 200 people broken down by gender about the latest congressional plan to eliminate anti-trust exemptions for professional baseball.
-Referring to Table 2-13, of the females in the sample, ________ percent were either neutral or against the plan.
(Short Answer)
4.8/5 (27)
Apple Computer, Inc. collected information on the age of their customers. The youngest customer was 12 and the oldest was 72. To study the percentage of their customers who are below a certain age, it can use an ogive.
(True/False)
4.9/5 (39)
The quality ("terrible", "poor", "fair", "acceptable", "very good" and "excellent") of a day care center is an example of a nominal scaled variable.
(True/False)
4.9/5 (39)
Retailers are always interested in determining why a customer selected their store to make a purchase. A sporting goods retailer conducted a customer survey to determine why its customers shopped at the store. The results are shown in the bar chart below. What proportion of the customers responded that they shopped at the store because of the merchandise or the convenience? 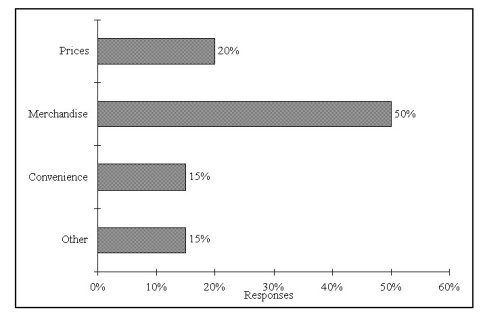
(Multiple Choice)
4.8/5 (31)
TABLE 2-1
The manager of the customer service division of a major consumer electronics company is interested in determining whether the customers who have purchased a DVD player made by the company over the past 12 months are satisfied with their products.
-Referring to Table 2-1, the possible responses to the question "How much time do you use the DVD player every week on the average?" result in
(Multiple Choice)
4.8/5 (40)
TABLE 2-3
At a meeting of information systems officers for regional offices of a national company, a survey was taken to determine the number of employees the officers supervise in the operation of their departments, where X is the number of employees overseen by each information systems officer.
-Referring to Table 2-3, how many regional offices are represented in the survey results?
(Multiple Choice)
4.7/5 (39)
You have collected data on the number of U.S. households actively using online banking and/or online bill payment from 1995 to 2007. Which of the following is the best for presenting the data?
(Multiple Choice)
4.9/5 (35)
In purchasing an automobile, there are a number of variables to consider. The classification of the car as a subcompact, compact, standard, or luxury size is an example of a ________ variable.
(Short Answer)
4.8/5 (41)
TABLE 2-9
The Stem-and-Leaf display represents the number of times in a year that a random sample of 100 "lifetime" members of a health club actually visited the facility.
 -Referring to Table 2-9, if a frequency distribution with equal sized classes was made from this data, and the first class was "0 but less than 10," the cumulative percentage of the next-to-last class would be ________.
(Short Answer)
4.9/5 (26)
Filters
- Essay(0)
- Multiple Choice(0)
- Short Answer(0)
- True False(0)
- Matching(0)