Exam 12: Statistically Based Quality Improvement for Attributes
Exam 1: Differing Perspectives on Quality111 Questions
Exam 2: Quality Theory101 Questions
Exam 3: Global Supply Chain Quality and International Quality Standards103 Questions
Exam 4: Strategic Quality Planning104 Questions
Exam 5: The Voice of the Customer100 Questions
Exam 6: The Voice of the Market102 Questions
Exam 7: Quality and Innovation in Product and Process Design101 Questions
Exam 8: Designing Quality Services104 Questions
Exam 9: Managing Supplier Quality in the Supply Chain77 Questions
Exam 10: The Tools of Quality98 Questions
Exam 11: Statistically Based Quality Improvement for Variables99 Questions
Exam 12: Statistically Based Quality Improvement for Attributes100 Questions
Exam 13: Six Sigma Management and Lean Tools101 Questions
Exam 14: Managing Quality Improvement Teams and Projects101 Questions
Exam 15: Implementing and Validating the Quality System96 Questions
Select questions type
A quality engineer notes that a process produces data that are binomial and has been obtained using a sample space that is not constant. The primary interest of the process manager is in the percentage of bad parts. An appropriate control chart to use would be a(n) ________.
(Multiple Choice)
4.7/5  (29)
(29)
What is the reliability of a product with a failure rate of 0.015 per operating hour and a useful life of 250 hours?
(Multiple Choice)
4.9/5 (31)
Sensory attributes relate to whether or not a particular product or service performs as it is supposed to.
(True/False)
4.9/5 (37)
Use the following table to answer the question(s) below.
 -The producers of the Yugo automobile periodically inspect samples of 80 hoods for dents and scratches. A single flaw in a hood renders it unsuitable for installation in one of their fine automobiles. The results of the last 10 samples are shown. Calculate the standard error, snp, for the np chart.
(Multiple Choice)
4.9/5 (38)
________ attributes answer whether a service provider is empathetic or if their accounting systems report properly.
(Multiple Choice)
4.8/5 (39)
The mean time between failures is the average time before the product will fail.
(True/False)
4.8/5 (43)
An attribute is a continuous measurement such as weight, height, or volume.
(True/False)
4.8/5 (34)
A local fraternity is deciding between three different refrigerators. The refrigerators have a mean time between failure and mean time to repair as shown in the table. 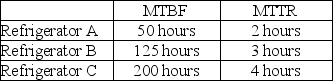 What refrigerator(s) will provide the greatest availability?
(Multiple Choice)
4.8/5 (29)
Attributes that are more internal and engineering-oriented are called ________ attributes.
(Multiple Choice)
4.7/5 (44)
Use the following table to answer the question(s) below.
 -A parks and recreation worker counts the number of paint drips on each standard size park bench. The results from the last 10 benches are shown. If the Parks Department decides to make a c chart, what should the center line be?
(Multiple Choice)
4.9/5 (33)
The reliability of components in series is the product of their individual reliabilities. What implications does this have for the Space Shuttle?
(Essay)
4.8/5 (44)
The producers of the Yugo automobile periodically inspect samples of 80 hoods for dents and scratches. A single flaw in a hood renders it unsuitable for installation in one of their fine automobiles. The results of the last 10 samples are shown. What sample is out of control?
(Multiple Choice)
4.8/5 (38)
A painter paints a wall and when too much paint is applied, drips result. In the language of attribute charts, the drips are ________.
(Multiple Choice)
4.9/5 (31)
A quality engineer notes that a process produces data that are binomial and has been obtained using a sample space that is not constant. The primary interest of the process manager is in the number of discrepancies per part. An appropriate control chart to use would be a(n) ________.
(Multiple Choice)
4.7/5 (36)
Use the following table to answer the question(s) below.
 -A manufacturer of FAX machines checks samples of 50 units for functionality at the conclusion of the assembly process. The results of 10 samples are shown. What is the average proportion defective?
(Multiple Choice)
4.8/5 (45)
A p chart can be used whether or not there is a constant sample size.
(True/False)
5.0/5 (37)
An insurance claims department employs 10 claims adjusters who spend all day verifying that forms are valid and have been completed correctly. Forms with mistakes are useless and must be returned to the adjuster who must contact the customer again and resubmit the claim. The supervisor reviews two claims processed by each employee to verify that the process is working at acceptable levels.
How should the process be monitored? Explain your reasoning.
(Essay)
4.9/5 (32)
Filters
- Essay(0)
- Multiple Choice(0)
- Short Answer(0)
- True False(0)
- Matching(0)