Exam 12: Statistically Based Quality Improvement for Attributes
Exam 1: Differing Perspectives on Quality111 Questions
Exam 2: Quality Theory101 Questions
Exam 3: Global Supply Chain Quality and International Quality Standards103 Questions
Exam 4: Strategic Quality Planning104 Questions
Exam 5: The Voice of the Customer100 Questions
Exam 6: The Voice of the Market102 Questions
Exam 7: Quality and Innovation in Product and Process Design101 Questions
Exam 8: Designing Quality Services104 Questions
Exam 9: Managing Supplier Quality in the Supply Chain77 Questions
Exam 10: The Tools of Quality98 Questions
Exam 11: Statistically Based Quality Improvement for Variables99 Questions
Exam 12: Statistically Based Quality Improvement for Attributes100 Questions
Exam 13: Six Sigma Management and Lean Tools101 Questions
Exam 14: Managing Quality Improvement Teams and Projects101 Questions
Exam 15: Implementing and Validating the Quality System96 Questions
Select questions type
Structural attributes have to do with physical characteristics of a particular product or service.
(True/False)
4.9/5  (27)
(27)
The reliability of a product having a failure rate of 0.0001 and a useful life of 2080 hours is 0.81.
(True/False)
4.8/5 (32)
What is the system availability for something that has a mean time between failures of 168 hours and needs an average of 48 hours to repair when it does fail?
(Multiple Choice)
4.9/5 (38)
A winemaker tastes several 750 ml bottles of varying vintages. A good choice for such a test would be a c chart.
(True/False)
4.9/5 (39)
A quality engineer notes that a process produces data that are binomial and has been obtained using a sample space that is constant. The primary interest of the process manager is in the percentage of bad parts. An appropriate control chart to use would be a(n) ________.
(Multiple Choice)
4.9/5 (28)
One way to achieve very high system availability would be for the mean time between failures to be as low as possible.
(True/False)
4.9/5 (29)
A unit that, as a whole, is not acceptable or does not meet performance requirements is a(n) ________.
(Multiple Choice)
4.9/5 (34)
A system has an availability of 90% and a mean time to repair of 48 hours. What is the mean time between failures?
(Multiple Choice)
4.9/5 (32)
A local university is deciding between three different computer networks. The network servers have a mean time between failure and mean time to repair as shown in the table. 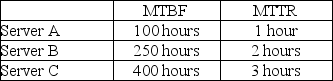 Which server(s) will provide the greatest availability?
(Multiple Choice)
4.7/5 (35)
A system is composed of three components in series having reliabilities of 0.85, 0.92, and 0.90. What is the overall system reliability?
(Multiple Choice)
4.8/5 (31)
A system is composed of three components in series having reliabilities of 0.99, 0.95, and 0.90. What is the overall system reliability?
(Multiple Choice)
4.9/5 (35)
Use the following table to answer the question(s) below.
 -A manufacturer of FAX machines checks samples of 50 units for functionality at the conclusion of the assembly process. The results of 10 samples are shown. What are the lower and upper 3-sigma control limits?
(Multiple Choice)
4.9/5 (34)
A producer of contact lenses regularly takes samples of 100 lenses and inspects them for scratches. If a lens has a single scratch, it cannot be sold. The results of 10 samples are shown. What sample is out of control?
(Multiple Choice)
4.9/5 (31)
Three items of reliability 0.90 in series has an overall system reliability of 0.73.
(True/False)
4.9/5 (29)
Determining whether a critical product characteristic is a variable or attribute is one of the steps in developing a process chart.
(True/False)
4.9/5 (33)
Customer-based attributes are internal and engineering-oriented.
(True/False)
4.9/5 (36)
Attribute charts are developed and interpreted the same way as variables charts.
(True/False)
4.8/5 (38)
Describe the differences between a defect and a defective. Provide an example of each and identify the types of process charts that would monitor defects and defectives.
(Essay)
4.8/5 (36)
The p chart is a process chart that is used to graph the proportion of items in a sample that are defective.
(True/False)
4.7/5 (33)
Filters
- Essay(0)
- Multiple Choice(0)
- Short Answer(0)
- True False(0)
- Matching(0)