Exam 10: The Tools of Quality
Exam 1: Differing Perspectives on Quality111 Questions
Exam 2: Quality Theory101 Questions
Exam 3: Global Supply Chain Quality and International Quality Standards103 Questions
Exam 4: Strategic Quality Planning104 Questions
Exam 5: The Voice of the Customer100 Questions
Exam 6: The Voice of the Market102 Questions
Exam 7: Quality and Innovation in Product and Process Design101 Questions
Exam 8: Designing Quality Services104 Questions
Exam 9: Managing Supplier Quality in the Supply Chain77 Questions
Exam 10: The Tools of Quality98 Questions
Exam 11: Statistically Based Quality Improvement for Variables99 Questions
Exam 12: Statistically Based Quality Improvement for Attributes100 Questions
Exam 13: Six Sigma Management and Lean Tools101 Questions
Exam 14: Managing Quality Improvement Teams and Projects101 Questions
Exam 15: Implementing and Validating the Quality System96 Questions
Select questions type
Calculate the number of classes if there are 32 observations in a data set.
Free
(Multiple Choice)
4.8/5  (35)
(35)
Correct Answer: Verified
C
The PDCA cycle, utilized with the seven new quality tools, stands for process-discovery-conform-accept.
Free
(True/False)
4.7/5 (43)
Correct Answer:Verified
False
Define a tree diagram and describe the steps used to complete a tree diagram.
Free
(Essay)
4.7/5 (38)
Correct Answer:Verified
A tree diagram is useful to identify the steps needed to address a given problem.
The following steps should be used to complete a tree diagram:
• Assemble the header cards from the affinity diagram. From these cards, choose the header card that represents the most important issue.
• Once the goal statement has been determined, ask, "What are the steps required to resolve or achieve this major objective or goal?"
• Once the major tasks have been identified, move to the next level under each task, and ask for the second level tasks, "What are the steps required to resolve or achieve this objective or goal?"
• Continue doing this for successive levels until you have exhausted your ideas for steps.
The first step in completing a(n) ________ is to assemble the header cards from the affinity diagram.
(Multiple Choice)
4.9/5 (34)
A scatter diagram is a graphical representation of data in a bar chart format.
(True/False)
4.9/5 (26)
Calculate the number of classes if there are 16 observations in a data set.
(Multiple Choice)
4.9/5 (39)
Define a scatter diagram and describe the steps involved in setting up a scatter plot.
(Essay)
4.8/5 (34)
An affinity diagram creates a hierarchy of ideas on a large surface.
(True/False)
4.9/5 (38)
The activity network diagram is also known as a PERT diagram or critical-path diagram and is used in controlling projects.
(True/False)
4.9/5 (35)
The RC and More Superstore decides to track customer complaints as part of their ongoing customer satisfaction improvement program. After collecting data for two months, their check sheet appears as follows: 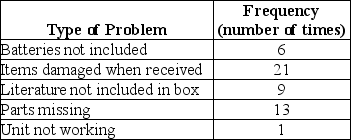 If they construct a Pareto chart, what is the cumulative percentage of the two left most bars?
(Multiple Choice)
4.8/5 (38)
The ________ is used to move to lower levels of abstraction in solving problems.
(Multiple Choice)
4.8/5 (38)
The ________ is also known as a PERT diagram or critical path diagram and is used in controlling projects.
(Multiple Choice)
4.7/5 (31)
Control charts are used to determine whether a process will produce a product or service with consistent measurable properties.
(True/False)
4.8/5 (38)
The matrix diagram is similar in concept to quality function deployment in its use of symbols, its layout, and its application.
(True/False)
4.9/5 (36)
The usefulness of the balanced scorecard comes from integrating financial measures of business success along with nonfinancial, operational information about the business.
(True/False)
4.9/5 (34)
Control charts are frequency charts that are aided by the 80/20 rule.
(True/False)
4.9/5 (31)
A(n) ________ is useful to identify the steps needed to address the given problem.
(Multiple Choice)
4.7/5 (34)
The RC and More Superstore decides to track customer complaints as part of their ongoing customer satisfaction improvement program. After collecting data for two months, their check sheet appears as follows: 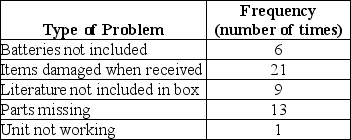 If they construct a Pareto chart, how many of these categories are required to make up 86% of all complaints?
(Multiple Choice)
4.8/5 (33)
Filters
- Essay(0)
- Multiple Choice(0)
- Short Answer(0)
- True False(0)
- Matching(0)