Exam 8: Measuring and Controlling Quality
Exam 1: Introduction to Quality80 Questions
Exam 2: Foundations of Quality Management80 Questions
Exam 3: Customer Focus80 Questions
Exam 4: Workforce Focus80 Questions
Exam 5: Process Focus79 Questions
Exam 6: Statistical Methods in Quality Management94 Questions
Exam 7: Design for Quality and Product Excellence80 Questions
Exam 8: Measuring and Controlling Quality105 Questions
Exam 9: Process Improvement and Six Sigma80 Questions
Exam 10: The Baldrige Framework for Performance Excellence80 Questions
Exam 11: Strategy and Performance Excellence78 Questions
Exam 12: Measurement and Knowledge Management for Performance Excellence80 Questions
Exam 13: Leadership for Performance Excellence80 Questions
Exam 14: Building and Sustaining Quality and Performance Excellence77 Questions
Select questions type
A(n)_____ characterizes the presence or absence of nonconformances in a unit of work.
(Multiple Choice)
4.7/5  (35)
(35)
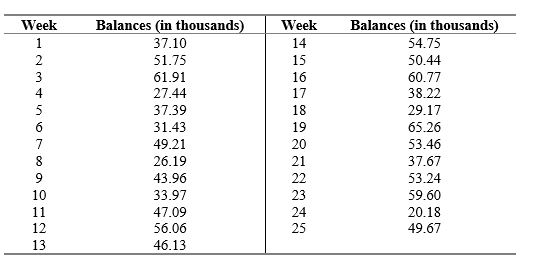
RM Industries wishes to monitor its end-of-week accounts receivable balance. To do so, the end-of-week balances for the previous 25 weeks were recorded and are shown below. Establish an x-chart and a moving range (using n = 2) chart for this process.
(Essay)
4.8/5 (43)
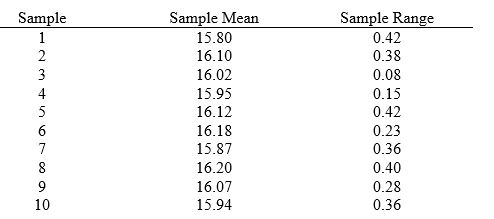
A process fills boxes with detergent.Construct an appropriate set of control limits to monitor the filling process.Historical data for fill weight (in ounces)of ten samples are presented below.A sample size of six was used.
(Essay)
5.0/5 (33)
Because of high test costs,a sample of single wastewater sludge is tested daily for dissolved oxygen content.The appropriate control chart is:
(Multiple Choice)
4.9/5 (37)
Process capability indices can be computed from data in an -chart.
(True/False)
4.8/5 (30)
25 samples of size 100 were collected and a total of 96 nonconforming items were found.The upper control limit for a p-chart would be:
(Multiple Choice)
4.8/5 (33)
The output of a process is stable and normally distributed.If the process mean equals 23.5,the percentage of output expected to be less than or equal to the mean:
(Multiple Choice)
4.9/5 (35)
The frequency of sampling in pre-control is often determined by dividing the time period between two successive out-of-control signals by six.
(True/False)
4.8/5 (36)
A histogram of data that resembles the normal distribution indicates that the process is in control.
(True/False)
4.8/5 (35)
In determining the method of sampling,samples should be chosen to be as heterogeneous as possible so that each sample reflects the system of common causes or assignable causes that may be present at that point in time.
(True/False)
4.9/5 (35)
A canning company defines a "nonconformance" as an orange juice can whose diameter is beyond the upper specification limit.A manager at the canning company wants to monitor the number of such orange juice cans produced per day.Each day,an employee will randomly select 120 cans over a period of four weeks.The employee then determines and plots the number of nonconformance cans in each sample.The appropriate control chart is a(n):
(Multiple Choice)
4.8/5 (27)
Common and special causes of variation must be eliminated before process capability can be determined.
(True/False)
4.8/5 (32)
For statistical process control,a good sampling method should always:
(Multiple Choice)
4.9/5 (42)
Histograms allow you to distinguish between common and special causes of variation.
(True/False)
4.8/5 (43)
If all sample averages on an -chart fall within the control limits,all output will be conforming.
(True/False)
4.7/5 (37)
A machined part has a lower specification limit of 3.5 inches and an upper specification limit of 3.9 inches.The range for the pre-control green zone is:
(Multiple Choice)
4.8/5 (30)
Filters
- Essay(0)
- Multiple Choice(0)
- Short Answer(0)
- True False(0)
- Matching(0)