Exam 8: Measuring and Controlling Quality
Exam 1: Introduction to Quality80 Questions
Exam 2: Foundations of Quality Management80 Questions
Exam 3: Customer Focus80 Questions
Exam 4: Workforce Focus80 Questions
Exam 5: Process Focus79 Questions
Exam 6: Statistical Methods in Quality Management94 Questions
Exam 7: Design for Quality and Product Excellence80 Questions
Exam 8: Measuring and Controlling Quality105 Questions
Exam 9: Process Improvement and Six Sigma80 Questions
Exam 10: The Baldrige Framework for Performance Excellence80 Questions
Exam 11: Strategy and Performance Excellence78 Questions
Exam 12: Measurement and Knowledge Management for Performance Excellence80 Questions
Exam 13: Leadership for Performance Excellence80 Questions
Exam 14: Building and Sustaining Quality and Performance Excellence77 Questions
Select questions type
In pre-control,which zone covers the nominal specification of a process?
(Multiple Choice)
4.7/5  (38)
(38)
If points on a control chart are determined to be the result of special causes,the points should be eliminated and new control limits should be computed.
(True/False)
4.7/5 (28)
A precision parts manufacturer produces bolts for use in military aircraft.The specifications for bolt length are 37.50 ± 0.25 cm.The company has established an -chart and an R-chart using samples of size five.The center lines for the -chart and R-chart are set at 37.35 cm and 1.05 cm,respectively.What is the value of Cpk for this process?
(Multiple Choice)
4.8/5 (40)
Control limits for variables and attributes data utilize different mathematical formulas.
(True/False)
4.9/5 (36)
A "hugging the center line" pattern in a control chart can be the result of taking each sample from a different process but not mixed together.
(True/False)
4.7/5 (33)
A precision parts manufacturer produces bolts for use in military aircraft.The specifications for bolt length are 37.50 ± 0.25 cm.The company has established an -chart and an R-chart using samples of size five.The center lines for the -chart and R-chart are set at 35.25 cm and 1.08 cm,respectively.What is the value of Cp for this process?
(Multiple Choice)
4.9/5 (39)
Construct a flow chart that illustrates the decision process for selecting the appropriate control chart(s)for monitoring a given process.
(Essay)
4.9/5 (36)
A company wishes to monitor the variation in the length of time it takes to process and send a bill to a customer.Seven bills will be randomly selected each day for a 60-day period and the length of time it takes to process and send the bill to a customer will be recorded for each bill.The appropriate control chart is a(n):
(Multiple Choice)
4.7/5 (32)
The center line for the np-chart is the average number of nonconforming items per sample.
(True/False)
4.9/5 (34)
A quality engineer took 40 samples of 100 transistors each from the output of an assembly line.Each transistor was tested and the number of defectives in each sample is recorded in the table below.Determine the control chart limits for a p-chart.
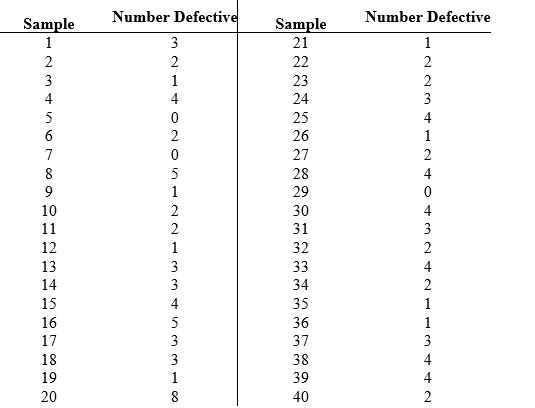
(Essay)
4.8/5 (42)
A better alternative to the -chart to monitor variation is to compute and plot the standard deviation s of each sample.
(True/False)
4.9/5 (30)
Which of the following is NOT an indication of an out-of-control process?
(Multiple Choice)
4.7/5 (38)
Attribute measurement requires a much larger sample size than variable measurement to obtain the same amount of statistical information.
(True/False)
4.7/5 (39)
A specification is 50.0 cm ± 10.0 cm.Sketch and label the pre-control zones for this specification.Include the following values on your sketch: nominal,upper and lower specification limits,and end points of the green zone.
(Short Answer)
4.8/5 (30)
What were some of the errors that the analysis uncovered at the distributor?
(Essay)
4.9/5 (33)
Filters
- Essay(0)
- Multiple Choice(0)
- Short Answer(0)
- True False(0)
- Matching(0)