Exam 16: Simple Linear Regression and Correlation
Exam 1: What Is Statistics43 Questions
Exam 2: Graphical Descriptive Techniques I93 Questions
Exam 3: Graphical Descriptive Techniques II183 Questions
Exam 4: Numerical Descriptive Techniques274 Questions
Exam 5: Data Collection and Sampling82 Questions
Exam 6: Probability234 Questions
Exam 7: Random Variables and Discrete Probability Distributions274 Questions
Exam 8: Continuous Probability Distributions215 Questions
Exam 9: Sampling Distributions153 Questions
Exam 10: Introduction to Estimation152 Questions
Exam 11: Introduction to Hypothesis Testing182 Questions
Exam 12: Inference About a Population147 Questions
Exam 13: Inference About Comparing Two Populations170 Questions
Exam 14: Analysis of Variance153 Questions
Exam 15: Chi-Squared Tests175 Questions
Exam 16: Simple Linear Regression and Correlation298 Questions
Exam 17: Multiple Regression157 Questions
Select questions type
The coefficient of ____________________ measures the amount of variation in the dependent variable that is explained by the variation in the independent variable.
(Short Answer)
4.8/5  (34)
(34)
U V's and Skin Cancer
A medical statistician wanted to examine the relationship between the amount of UV's (x) and incidence of skin cancer (y).As an experiment he found the number of skin cancers detected per 100,000 of population and the average daily sunshine in eight states around the country.These data are shown below.
 -{Sales and Experience Narrative} Determine the standard error of estimate and describe what this statistic tells you about the regression line.
(Essay)
4.7/5 (41)
A prediction interval for a particular y is always ____________________ than a confidence interval for the mean of y.
(Short Answer)
4.8/5 (40)
Consider the following data values of variables x and y.
 a.
Determine the least squares regression line.
b.
Find the predicted value of y for x = 9.
c.
What does the value of the slope of the regression line tell you?
a.
Determine the least squares regression line.
b.
Find the predicted value of y for x = 9.
c.
What does the value of the slope of the regression line tell you?
(Essay)
4.9/5 (30)
A straight line regression model with only one independent variable is called a(n) ____________________-order linear model.
(Short Answer)
4.9/5 (32)
The coefficient of determination is equal to the coefficient of correlation squared.
(True/False)
4.8/5 (38)
A regression analysis between sales (in $1000) and advertising (in $100) resulted in the following least squares line:  .This implies that if advertising is $600, then the predicted amount of sales (in dollars) is $125,000.
(True/False)
4.8/5 (39)
Allman Brothers Concert
At a recent Allman Brothers concert, a survey was conducted that asked a random sample of 20 people their age and how many concerts they have attended since the first of the year.The following data were collected:
 An Excel output follows:
 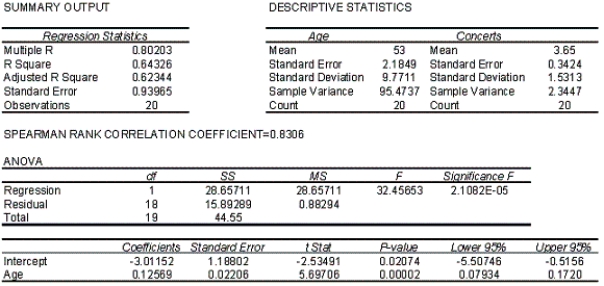 -{Allman Brothers Concert Narrative} Estimate the number of Allman Brothers concerts attended by a 64 year old person.
(Essay)
4.8/5 (36)
Comedy Shows Revenues
A financier whose specialty is investing in comedy shows has observed that, in general, shows with "big-name" stars seem to generate more revenue than those shows whose stars are less well known.To examine his belief he records the gross revenue and the payment (in $ millions) given to the two highest-paid comedians in the show for ten recently staged shows.
 -{Comedy Shows Revenues Narrative} Use the predicted and actual values of y to calculate the residuals.
(Essay)
4.9/5 (23)
The deviations between the actual data points and the fitted values from the model are called ____________________.
(Short Answer)
4.8/5 (39)
A regression analysis between sales (in $1,000) and advertising (in $1,000) resulted in the following least squares line:  .This implies that:
(Multiple Choice)
4.8/5 (39)
Theatre Revenues
A financier whose specialty is investing in stage productions has observed that, in general, movies with "big-name" stars seem to generate more revenue than those plays whose stars are less well known.To examine his belief he records the gross revenue and the payment (in $ millions) given to the two highest-paid performers in the play for ten recently staged plays.
 -{Theatre Revenues Narrative} Interpret the value of the slope of the regression line.
(Essay)
4.8/5 (28)
Grateful Dead Concert
At a recent Grateful Dead concert, a survey was conducted that asked a random sample of 20 people their age and how many concerts they have attended since the first of the year.It is suspected that older concert goers tend to go to more of his concerts in one year than younger concert goers.The data and analysis are shown below.
 An Excel output follows:
 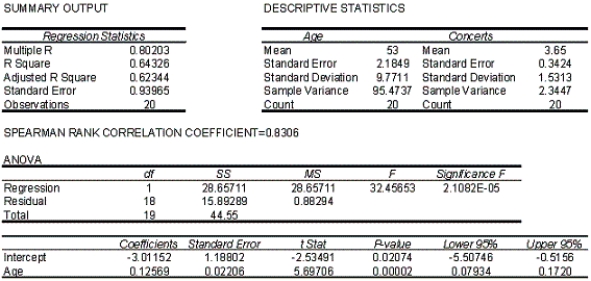 -{Grateful Dead Concert Narrative} Calculate the Pearson correlation coefficient and interpret.
(Essay)
4.8/5 (29)
When the variance  of the error variable
  is a constant no matter what the value of x is, this condition is called:
(Multiple Choice)
4.8/5 (33)
Grateful Dead Concert
At a recent Grateful Dead concert, a survey was conducted that asked a random sample of 20 people their age and how many concerts they have attended since the first of the year.It is suspected that older concert goers tend to go to more of his concerts in one year than younger concert goers.The data and analysis are shown below.
An Excel output follows:
-{Oil Quality and Price Narrative} Determine the standard error of estimate and describe what this statistic tells you.
(Essay)
4.8/5 (41)
U V's and Skin Cancer
A medical statistician wanted to examine the relationship between the amount of UV's (x) and incidence of skin cancer (y).As an experiment he found the number of skin cancers detected per 100,000 of population and the average daily sunshine in eight states around the country.These data are shown below.
-{Sales and Experience Narrative} Do the tests of  and 1 in the previous two questions provide the same results? Explain.
(Essay)
4.8/5 (44)
Theatre Revenues
A financier whose specialty is investing in stage productions has observed that, in general, movies with "big-name" stars seem to generate more revenue than those plays whose stars are less well known.To examine his belief he records the gross revenue and the payment (in $ millions) given to the two highest-paid performers in the play for ten recently staged plays.
-{Theatre Revenues Narrative} Are the two highest paid performers worth all the money paid for them? Comment using the statistical analyses you have done.
(Essay)
4.8/5 (28)
The width of the confidence interval estimate for the predicted value of y depends on
(Multiple Choice)
4.9/5 (42)
If you take a particular x value and plug it into a regression line equation, the result is a(n) ____________________ estimate for y.
(Short Answer)
4.9/5 (38)
If the regression line is horizontal, then we conclude that y ____________________ (is/is not) related to x.
(Short Answer)
4.8/5 (39)
Filters
- Essay(0)
- Multiple Choice(0)
- Short Answer(0)
- True False(0)
- Matching(0)