Exam 16: Simple Linear Regression and Correlation
Exam 1: What Is Statistics43 Questions
Exam 2: Graphical Descriptive Techniques I93 Questions
Exam 3: Graphical Descriptive Techniques II183 Questions
Exam 4: Numerical Descriptive Techniques274 Questions
Exam 5: Data Collection and Sampling82 Questions
Exam 6: Probability234 Questions
Exam 7: Random Variables and Discrete Probability Distributions274 Questions
Exam 8: Continuous Probability Distributions215 Questions
Exam 9: Sampling Distributions153 Questions
Exam 10: Introduction to Estimation152 Questions
Exam 11: Introduction to Hypothesis Testing182 Questions
Exam 12: Inference About a Population147 Questions
Exam 13: Inference About Comparing Two Populations170 Questions
Exam 14: Analysis of Variance153 Questions
Exam 15: Chi-Squared Tests175 Questions
Exam 16: Simple Linear Regression and Correlation298 Questions
Exam 17: Multiple Regression157 Questions
Select questions type
Truck Speed and Gas Mileage
An economist wanted to analyze the relationship between the speed of a truck (x) and its gas mileage (y).As an experiment a truck is operated at several different speeds and for each speed the gas mileage is measured.These data are shown below.
 -{Truck Speed and Gas Mileage Narrative} Calculate the standard error of estimate, and describe what this statistic tells you about the regression line.
(Essay)
4.9/5  (36)
(36)
Grateful Dead Concert
At a recent Grateful Dead concert, a survey was conducted that asked a random sample of 20 people their age and how many concerts they have attended since the first of the year.It is suspected that older concert goers tend to go to more of his concerts in one year than younger concert goers.The data and analysis are shown below.
 An Excel output follows:
 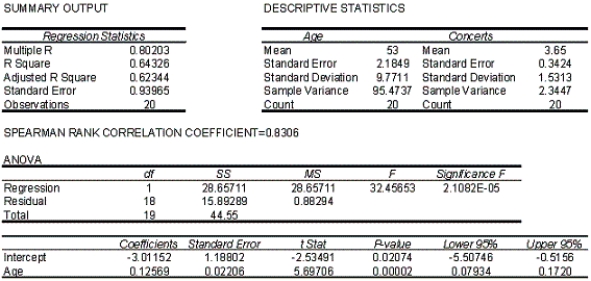 -{Oil Quality and Price Narrative} Do the
  and 1 tests in the previous two questions provide the same results? Explain.
(Essay)
4.8/5 (30)
Given the least squares regression line  , and a coefficient of determination of 0.81, the coefficient of correlation is:
(Multiple Choice)
4.8/5 (32)
If the variance of the errors is constant for each predicted y value, the condition is called ____________________.
(Short Answer)
4.8/5 (33)
The graph of a confidence interval for the expected value of y is represented by two curved lines, one on either side of the regression line.
(True/False)
4.8/5 (41)
Oil Quality and Price
Quality of oil is measured in API gravity degrees--the higher the degrees API, the higher the quality.The table shown below is produced by an expert in the field who believes that there is a relationship between quality and price per barrel.
 A partial Minitab output follows:


 -{Oil Quality and Price Narrative} Does it appear that the errors are normally distributed? Explain.
(Essay)
4.9/5 (33)
The sample correlation coefficient between x and y is 0.375.It has been found out that the p-value is 0.256 when testing H0:  = 0 against the two-sided alternative H1: 11ef1757_23ab_7ed6_8934_0f04996b5575_TB7453_11 0.To test H0: 11ef1757_23ab_7ed6_8934_0f04996b5575_TB7453_11= 0 against the one-sided alternative H1: 11ef1757_23ab_7ed6_8934_0f04996b5575_TB7453_11> 0 at a significant level of 0.193, the p-value will be equal to
(Multiple Choice)
4.9/5 (27)
The value of the sum of squares for regression SSR can never be smaller than 0.0.
(True/False)
5.0/5 (31)
In testing the hypotheses: H0: 1 = 0 vs.H0: 1 0, the following statistics are available:  ,
,  ,
,  ,
,  , and
, and  .The value of the test statistic is:
(Multiple Choice)
4.8/5 (33)
If the coefficient of determination is 0.95, this means that 95% of the variation in the independent variable x can be explained by the y variable.
(True/False)
5.0/5 (37)
Consider the following data values of variables x and y.
 a.
Calculate the coefficient of determination, and describe what this statistic tells you about the relationship between the two variables.
b.
Calculate the Pearson coefficient of correlation.What sign does it have? Why?
c.
What does the coefficient of correlation calculated tell you about the direction and strength of the relationship between the two variables?
a.
Calculate the coefficient of determination, and describe what this statistic tells you about the relationship between the two variables.
b.
Calculate the Pearson coefficient of correlation.What sign does it have? Why?
c.
What does the coefficient of correlation calculated tell you about the direction and strength of the relationship between the two variables?
(Essay)
4.9/5 (25)
Cost of Books
The editor of a major academic book publisher claims that a large part of the cost of books is the cost of paper.This implies that larger books will cost more money.As an experiment to analyze the claim, a university student visits the bookstore and records the number of pages and the selling price of twelve randomly selected books.These data are listed below.
 -{Cost of Books Narrative} Can we infer at the 5% significance level that the editor is correct?
(Essay)
4.7/5 (38)
Speed vs Gas Mileage
An economist wanted to analyze the relationship between the speed of a car (x) and its gas mileage (y).As an experiment a car is operated at several different speeds and for each speed the gas mileage is measured.These data are shown below.
 -{Car Speed and Gas Mileage Narrative} Determine the least squares regression line.
(Short Answer)
4.8/5 (37)
When all the actual values of y are equal to their predicted values, the standard error of estimate will be:
(Multiple Choice)
4.8/5 (32)
A zero correlation coefficient between a pair of random variables means that there is no linear relationship between the random variables.
(True/False)
4.8/5 (37)
If the plot of the residuals vs.the predicted values resembles a straight line with non-zero slope, then the regression line fits well.
(True/False)
4.8/5 (39)
Oil Quality and Price
Quality of oil is measured in API gravity degrees--the higher the degrees API, the higher the quality.The table shown below is produced by an expert in the field who believes that there is a relationship between quality and price per barrel.
 A partial Minitab output follows:


 -{Oil Quality and Price Narrative} Interpret the value of the slope of the regression line.
(Essay)
4.9/5 (41)
The vertical spread of the data points about the regression line is measured by the y-intercept.
(True/False)
4.9/5 (44)
Rock Concert Revenues
A financier whose specialty is investing in rock concerts has observed that, in general, concerts with "big-name" stars seem to generate more revenue than those concerts whose stars are less well known.To examine his belief he records the gross revenue and the payment (in $ millions) given to the two highest-paid performers in the concert for ten concert tours.
 -{Rock Concert Revenues Narrative} Conduct a test of the population coefficient of correlation to determine at the 5% significance level whether a positive linear relationship exists between payment to the two highest-paid performers and gross revenue.
(Essay)
5.0/5 (40)
Given that the sum of squares for error is 60 and the sum of squares for regression is 140, then the coefficient of determination is:
(Multiple Choice)
4.8/5 (27)
Filters
- Essay(0)
- Multiple Choice(0)
- Short Answer(0)
- True False(0)
- Matching(0)