Exam 16: Simple Linear Regression and Correlation
Exam 1: What Is Statistics43 Questions
Exam 2: Graphical Descriptive Techniques I93 Questions
Exam 3: Graphical Descriptive Techniques II183 Questions
Exam 4: Numerical Descriptive Techniques274 Questions
Exam 5: Data Collection and Sampling82 Questions
Exam 6: Probability234 Questions
Exam 7: Random Variables and Discrete Probability Distributions274 Questions
Exam 8: Continuous Probability Distributions215 Questions
Exam 9: Sampling Distributions153 Questions
Exam 10: Introduction to Estimation152 Questions
Exam 11: Introduction to Hypothesis Testing182 Questions
Exam 12: Inference About a Population147 Questions
Exam 13: Inference About Comparing Two Populations170 Questions
Exam 14: Analysis of Variance153 Questions
Exam 15: Chi-Squared Tests175 Questions
Exam 16: Simple Linear Regression and Correlation298 Questions
Exam 17: Multiple Regression157 Questions
Select questions type
If the coefficient of correlation is 0.90, then the percentage of the variation in the dependent variable y that is explained by the variation in the independent variable x is:
(Multiple Choice)
4.9/5  (30)
(30)
A regression line using 25 observations produced SSR = 118.68 and SSE = 56.32.The standard error of estimate was:
(Multiple Choice)
4.8/5 (31)
In the simple linear regression model, the slope represents the:
(Multiple Choice)
4.9/5 (44)
Sunshine and Melanoma
A medical researcher wanted to examine the relationship between the amount of sunshine (x) in hours, and incidence of melanoma, a type of skin cancer (y).As an experiment he found the number of melanoma cases detected per 100,000 of population and the average daily sunshine in eight counties around the country.These data are shown below.
 -{Sunshine and Melanoma Narrative} Draw a scatter diagram of the data and plot the least squares regression line on it.
(Essay)
4.7/5 (34)
A regression analysis between sales (in $1000) and advertising (in $100) resulted in the following least squares line:  .This implies that if advertising is $800, then the predicted amount of sales (in dollars) is:
(Multiple Choice)
4.8/5 (26)
U V's and Skin Cancer
A medical statistician wanted to examine the relationship between the amount of UV's (x) and incidence of skin cancer (y).As an experiment he found the number of skin cancers detected per 100,000 of population and the average daily sunshine in eight states around the country.These data are shown below.
 -{UV's and Skin Cancer Narrative} What does the coefficient of correlation calculated tell you about the direction and strength of the relationship between the two variables?
(Essay)
4.8/5 (36)
If you take the residuals, subtract their mean and divide by their standard deviation, the result is called the ____________________ residuals.
(Short Answer)
4.8/5 (36)
Cost of Textbooks
The editor of a higher education book publisher claims that a large part of the cost of books is the cost of paper.This implies that larger textbooks will cost more money.As an experiment to analyze the claim, a university student visits the bookstore and records the number of pages and the selling price of twelve randomly selected textbooks.These data are listed below.
 -{Cost of Textbooks Narrative} Estimate the selling price for a 650 pages book.
(Essay)
4.8/5 (29)
The value of the sum of squares for regression SSR can never be larger than the value of total sum of squares SST.
(True/False)
4.9/5 (26)
U V's and Skin Cancer
A medical statistician wanted to examine the relationship between the amount of UV's (x) and incidence of skin cancer (y).As an experiment he found the number of skin cancers detected per 100,000 of population and the average daily sunshine in eight states around the country.These data are shown below.
-{UV's and Skin Cancer Narrative} Calculate the coefficient of determination and interpret it.
(Essay)
4.8/5 (26)
The farther a given value of x is from the mean of x, the ____________________ the estimated error becomes.
(Short Answer)
4.7/5 (41)
A confidence interval estimate for the expected value of y will always be wider than the prediction interval for the same given value of x and the same confidence level.
(True/False)
4.8/5 (30)
For a regression analysis to be valid, the error variable must have a standard deviation that is ____________________ regardless of the value of x.
(Short Answer)
4.8/5 (35)
Game Show Winnings & Education
An ardent fan of television game shows has observed that, in general, the more educated the contestant, the less money he or she wins.To test her belief she gathers data about the last eight winners of her favorite game show.She records their winnings in dollars and the number of years of education.The results are as follows.
 -{Game Show Winnings & Education Narrative} Conduct a test of the population slope to determine at the 5% significance level whether a negative linear relationship exists between years of education and TV game shows' winnings.
(Essay)
4.9/5 (38)
Game Show Winnings & Education
An ardent fan of television game shows has observed that, in general, the more educated the contestant, the less money he or she wins.To test her belief she gathers data about the last eight winners of her favorite game show.She records their winnings in dollars and the number of years of education.The results are as follows.
-{Game Show Winnings & Education Narrative} Conduct a test of the population coefficient of correlation to determine at the 5% significance level whether a negative linear relationship exists between years of education and TV game shows' winnings.
(Essay)
4.8/5 (32)
Wayne Newton Concert
At a recent Wayne Newton concert, a survey was conducted that asked a random sample of 20 people their age and how many concerts they have attended since the first of the year.The following data were collected:
 An Excel output follows:
 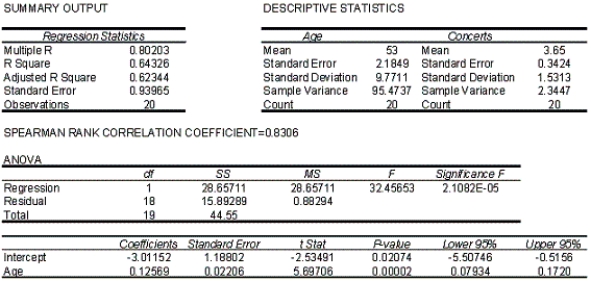 -{Wayne Newton Concert Narrative} Predict with 95% confidence the number of concerts attended by a 45 year-old individual.
(Essay)
4.8/5 (38)
In simple linear regression, which of the following statements indicates there is no linear relationship between the variables x and y?
(Multiple Choice)
4.9/5 (39)
The least squares method for determining the best fit minimizes:
(Multiple Choice)
4.9/5 (33)
In the first-order linear regression model, the population parameters of the y-intercept and the slope are, respectively,
(Multiple Choice)
4.9/5 (29)
Wayne Newton Concert
At a recent Wayne Newton concert, a survey was conducted that asked a random sample of 20 people their age and how many concerts they have attended since the first of the year.The following data were collected:
An Excel output follows:
-{Wayne Newton Concert Narrative} Which interval in the previous two questions is narrower: the confidence interval estimate of the expected value of y or the prediction interval for the same given value of x (10 years) and same confidence level? Why?
(Essay)
4.9/5 (30)
Filters
- Essay(0)
- Multiple Choice(0)
- Short Answer(0)
- True False(0)
- Matching(0)