Exam 16: Simple Linear Regression and Correlation
Exam 1: What Is Statistics43 Questions
Exam 2: Graphical Descriptive Techniques I93 Questions
Exam 3: Graphical Descriptive Techniques II183 Questions
Exam 4: Numerical Descriptive Techniques274 Questions
Exam 5: Data Collection and Sampling82 Questions
Exam 6: Probability234 Questions
Exam 7: Random Variables and Discrete Probability Distributions274 Questions
Exam 8: Continuous Probability Distributions215 Questions
Exam 9: Sampling Distributions153 Questions
Exam 10: Introduction to Estimation152 Questions
Exam 11: Introduction to Hypothesis Testing182 Questions
Exam 12: Inference About a Population147 Questions
Exam 13: Inference About Comparing Two Populations170 Questions
Exam 14: Analysis of Variance153 Questions
Exam 15: Chi-Squared Tests175 Questions
Exam 16: Simple Linear Regression and Correlation298 Questions
Exam 17: Multiple Regression157 Questions
Select questions type
A direct relationship between an independent variable x and a dependent variably y means that the variables x and y increase or decrease together.
(True/False)
4.9/5  (36)
(36)
Income and Education
A professor of economics wants to study the relationship between income (y in $1000s) and education (x in years).A random sample eight individuals is taken and the results are shown below.
 -{Income and Education Narrative} Interpret the value of the slope of the regression line.
(Essay)
4.9/5 (37)
Game Winnings & Education
An ardent fan of television game shows has observed that, in general, the more educated the contestant, the less money he or she wins.To test her belief she gathers data about the last eight winners of her favorite game show.She records their winnings in dollars and the number of years of education.The results are as follows.
 -{Game Winnings & Education Narrative} Compute the standardized residuals.
(Essay)
4.9/5 (35)
Allman Brothers Concert
At a recent Allman Brothers concert, a survey was conducted that asked a random sample of 20 people their age and how many concerts they have attended since the first of the year.The following data were collected:
 An Excel output follows:
 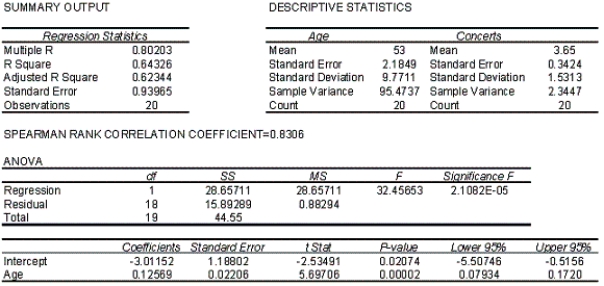 -{Allman Brothers Concert Narrative} Draw a scatter diagram of the data.Comment on whether it appears that a linear model might be appropriate to describe the relationship between the age and number of concerts attended by the respondents.
(Essay)
4.7/5 (30)
Truck Speed and Gas Mileage
An economist wanted to analyze the relationship between the speed of a truck (x) and its gas mileage (y).As an experiment a truck is operated at several different speeds and for each speed the gas mileage is measured.These data are shown below.
 -{Truck Speed and Gas Mileage Narrative} Calculate the Pearson coefficient of correlation.
(Short Answer)
4.9/5 (33)
Accidents and Rain
A statistician investigating the relationship between the amount of rain (in inches) and the number of automobile accidents gathered data on accidents in her city for 10 randomly selected days throughout the year.The results are shown below.
 -{Accidents and Rain Narrative} Estimate the number of accidents in a day with 0.25 inches of rain.
(Essay)
4.8/5 (26)
If cov(x, y) = 1260,  , and
, and  , then the coefficient of determination is:
(Multiple Choice)
4.8/5 (29)
Grateful Dead Concert
At a recent Grateful Dead concert, a survey was conducted that asked a random sample of 20 people their age and how many concerts they have attended since the first of the year.It is suspected that older concert goers tend to go to more of his concerts in one year than younger concert goers.The data and analysis are shown below.
 An Excel output follows:
 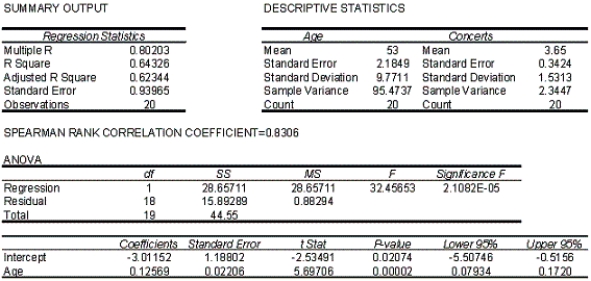 -{Oil Quality and Price Narrative} Determine the coefficient of determination and discuss what its value tells you about the two variables.
(Essay)
4.8/5 (26)
Grateful Dead Concert
At a recent Grateful Dead concert, a survey was conducted that asked a random sample of 20 people their age and how many concerts they have attended since the first of the year.It is suspected that older concert goers tend to go to more of his concerts in one year than younger concert goers.The data and analysis are shown below.
An Excel output follows:
-{Grateful Dead Concert Narrative} Conduct a test of the population slope to determine at the 5% significance level whether a positive linear relationship exists between age and number of concerts attended.
(Essay)
4.8/5 (33)
Oil Quality and Price
Quality of oil is measured in API gravity degrees--the higher the degrees API, the higher the quality.The table shown below is produced by an expert in the field who believes that there is a relationship between quality and price per barrel.
 A partial Minitab output follows:


 -{Oil Quality and Price Narrative} Determine the least squares regression line.
(Essay)
4.7/5 (39)
If we are interested in determining whether two variables are linearly related, it is necessary to:
(Multiple Choice)
4.9/5 (42)
You cannot interpret the ____________________ of the simple linear regression line unless the value of x = 0 lies within the range of where data was collected.
(Short Answer)
4.9/5 (33)
The probability distribution of the error variable  is normal, with mean E(11ef1755_bfc9_62c0_8934_f37f63227316_TB7453_11) = 0, and standard deviation 11ef1755_bfc9_62c0_8934_f37f63227316_TB7453_11
  =1.
=1.
(True/False)
4.8/5 (28)
Trivia Games & Education
An ardent fan of television game shows has observed that, in general, the more educated the contestant, the less money he or she wins.To test her belief she gathers data about the last eight winners of her favorite game show.She records their winnings in dollars and the number of years of education.The results are as follows.
 -{Trivia Games & Education Narrative} Interpret the value of the slope of the regression line.
(Essay)
4.8/5 (30)
Oil Quality and Price
Quality of oil is measured in API gravity degrees--the higher the degrees API, the higher the quality.The table shown below is produced by an expert in the field who believes that there is a relationship between quality and price per barrel.
 A partial Minitab output follows:


 -{Oil Quality and Price Narrative} Identify possible outliers.
(Essay)
4.8/5 (30)
A regression analysis between weight (y in pounds) and height (x in inches) resulted in the following least squares line:  .This implies that if the height is increased by 1 inch, the weight is expected to increase by an average of 6 pounds.
(True/False)
4.9/5 (25)
The method statisticians use to produce a straight line that minimizes the SSE is called the ____________________ method.
(Short Answer)
4.8/5 (37)
Telemarketing Sales and Experience
The general manager of a telemarketing company believes that experience is the most important factor in determining the level of success of a telemarketer.To examine this belief she records last month's sales (in $1,000s) and the years of experience of 10 randomly selected telemarketers.These data are listed below.
 -{Telemarketer Sales and Experience Narrative} Identify possible outliers.
(Essay)
4.8/5 (27)
Game Show Winnings & Education
An ardent fan of television game shows has observed that, in general, the more educated the contestant, the less money he or she wins.To test her belief she gathers data about the last eight winners of her favorite game show.She records their winnings in dollars and the number of years of education.The results are as follows.
 -{Game Show Winnings & Education Narrative} Determine the coefficient of determination and discuss what its value tells you about the two variables.
(Essay)
4.9/5 (37)
Oil Quality and Price
Quality of oil is measured in API gravity degrees--the higher the degrees API, the higher the quality.The table shown below is produced by an expert in the field who believes that there is a relationship between quality and price per barrel.
A partial Minitab output follows:
-{Oil Quality and Price Narrative} Does it appear that heteroscedasticity is a problem? Explain.
(Essay)
4.9/5 (41)
Filters
- Essay(0)
- Multiple Choice(0)
- Short Answer(0)
- True False(0)
- Matching(0)