Exam 16: Simple Linear Regression and Correlation
Exam 1: What Is Statistics43 Questions
Exam 2: Graphical Descriptive Techniques I93 Questions
Exam 3: Graphical Descriptive Techniques II183 Questions
Exam 4: Numerical Descriptive Techniques274 Questions
Exam 5: Data Collection and Sampling82 Questions
Exam 6: Probability234 Questions
Exam 7: Random Variables and Discrete Probability Distributions274 Questions
Exam 8: Continuous Probability Distributions215 Questions
Exam 9: Sampling Distributions153 Questions
Exam 10: Introduction to Estimation152 Questions
Exam 11: Introduction to Hypothesis Testing182 Questions
Exam 12: Inference About a Population147 Questions
Exam 13: Inference About Comparing Two Populations170 Questions
Exam 14: Analysis of Variance153 Questions
Exam 15: Chi-Squared Tests175 Questions
Exam 16: Simple Linear Regression and Correlation298 Questions
Exam 17: Multiple Regression157 Questions
Select questions type
Rock Concert Revenues
A financier whose specialty is investing in rock concerts has observed that, in general, concerts with "big-name" stars seem to generate more revenue than those concerts whose stars are less well known.To examine his belief he records the gross revenue and the payment (in $ millions) given to the two highest-paid performers in the concert for ten concert tours.
 -{Rock Concert Revenues Narrative} Do the
  and 1 tests in the previous questions provide the same results? Explain.
(Essay)
4.8/5  (40)
(40)
A zero population correlation coefficient for x and y means that there is no type of relationship whatsoever between x and y.
(True/False)
4.7/5 (38)
When the error variable does not have constant variance, this condition is called ____________________.
(Short Answer)
4.9/5 (30)
Trivia Games & Education
An ardent fan of television game shows has observed that, in general, the more educated the contestant, the less money he or she wins.To test her belief she gathers data about the last eight winners of her favorite game show.She records their winnings in dollars and the number of years of education.The results are as follows.
 -{Trivia Games & Education Narrative} Estimate the game winnings for a contestant with 15 years of education.
(Essay)
4.9/5 (32)
Truck Speed and Gas Mileage
An economist wanted to analyze the relationship between the speed of a truck (x) and its gas mileage (y).As an experiment a truck is operated at several different speeds and for each speed the gas mileage is measured.These data are shown below.
 -{Truck Speed and Gas Mileage Narrative} Calculate the coefficient of determination and interpret its value.
(Essay)
4.8/5 (33)
Game Winnings & Education
An ardent fan of television game shows has observed that, in general, the more educated the contestant, the less money he or she wins.To test her belief she gathers data about the last eight winners of her favorite game show.She records their winnings in dollars and the number of years of education.The results are as follows.
 -{Game Winnings & Education Narrative} Plot the residuals against the predicted values
  .What does the graph tell you?
(Essay)
4.9/5 (21)
Oil Quality and Price
Quality of oil is measured in API gravity degrees--the higher the degrees API, the higher the quality.The table shown below is produced by an expert in the field who believes that there is a relationship between quality and price per barrel.
 A partial Minitab output follows:


 -{Oil Quality and Price Narrative} Plot the least squares regression line on the scatter diagram.
(Essay)
4.8/5 (36)
The least squares method requires that the variance  of the error variable
 is a constant no matter what the value of x is.When this requirement is violated, the condition is called:
(Multiple Choice)
4.9/5 (27)
U V's and Skin Cancer
A medical statistician wanted to examine the relationship between the amount of UV's (x) and incidence of skin cancer (y).As an experiment he found the number of skin cancers detected per 100,000 of population and the average daily sunshine in eight states around the country.These data are shown below.
 -{UV's and Skin Cancer Narrative} Calculate the Pearson coefficient.What sign does it have? Why?
(Essay)
4.8/5 (36)
Testing whether the slope of the population regression line could be zero is equivalent to testing whether the:
(Multiple Choice)
4.8/5 (40)
Marc Anthony Concert
At a recent Marc Anthony concert, a survey was conducted that asked a random sample of 20 people their age and how many concerts they have attended since the first of the year.The following data were collected:
 An Excel output follows:
 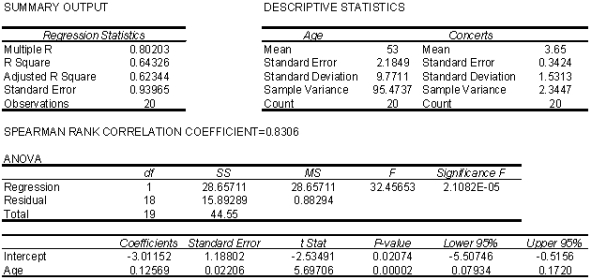 -{Marc Anthony Concert Narrative} Use the predicted values and the actual values of y to calculate the residuals.
(Essay)
4.9/5 (42)
In regression analysis, the coefficient of determination R2 measures the amount of variation in y that is:
(Multiple Choice)
4.7/5 (35)
Graphically, a confidence interval for the mean of y is represented as two ____________________ lines.
(Short Answer)
4.9/5 (38)
Income and Education
A professor of economics wants to study the relationship between income (y in $1000s) and education (x in years).A random sample eight individuals is taken and the results are shown below.
 -{Income and Education Narrative} Draw a scatter diagram of the data.Comment on whether it appears that a linear model might be appropriate.
(Essay)
4.8/5 (35)
An inverse relationship between an independent variable x and a dependent variably y means that as x increases, y decreases, and vice versa.
(True/False)
4.7/5 (35)
Movie Revenues
A financier whose specialty is investing in movie productions has observed that, in general, movies with "big-name" stars seem to generate more revenue than those movies whose stars are less well known.To examine his belief he records the gross revenue and the payment (in $ millions) given to the two highest-paid performers in the movie for ten recently released movies.
 -{Cost of Books Narrative} Predict with 90% confidence the selling price of a book with 900 pages.
(Essay)
4.8/5 (43)
Game Show Winnings & Education
An ardent fan of television game shows has observed that, in general, the more educated the contestant, the less money he or she wins.To test her belief she gathers data about the last eight winners of her favorite game show.She records their winnings in dollars and the number of years of education.The results are as follows.
 -{Game Show Winnings & Education Narrative} Determine the standard error of estimate and describe what this statistic tells you about the regression line.
(Essay)
4.9/5 (34)
Filters
- Essay(0)
- Multiple Choice(0)
- Short Answer(0)
- True False(0)
- Matching(0)