Exam 16: Simple Linear Regression and Correlation
Exam 1: What Is Statistics43 Questions
Exam 2: Graphical Descriptive Techniques I93 Questions
Exam 3: Graphical Descriptive Techniques II183 Questions
Exam 4: Numerical Descriptive Techniques274 Questions
Exam 5: Data Collection and Sampling82 Questions
Exam 6: Probability234 Questions
Exam 7: Random Variables and Discrete Probability Distributions274 Questions
Exam 8: Continuous Probability Distributions215 Questions
Exam 9: Sampling Distributions153 Questions
Exam 10: Introduction to Estimation152 Questions
Exam 11: Introduction to Hypothesis Testing182 Questions
Exam 12: Inference About a Population147 Questions
Exam 13: Inference About Comparing Two Populations170 Questions
Exam 14: Analysis of Variance153 Questions
Exam 15: Chi-Squared Tests175 Questions
Exam 16: Simple Linear Regression and Correlation298 Questions
Exam 17: Multiple Regression157 Questions
Select questions type
When the actual values y of a dependent variable and the corresponding predicted values  are the same, the standard error of the estimate will be 1.0.
(True/False)
4.8/5  (38)
(38)
Sunshine and Melanoma
A medical researcher wanted to examine the relationship between the amount of sunshine (x) in hours, and incidence of melanoma, a type of skin cancer (y).As an experiment he found the number of melanoma cases detected per 100,000 of population and the average daily sunshine in eight counties around the country.These data are shown below.
 -{Sunshine and Melanoma Narrative} Determine the least squares regression line.
(Short Answer)
4.9/5 (31)
Theatre Revenues
A financier whose specialty is investing in stage productions has observed that, in general, movies with "big-name" stars seem to generate more revenue than those plays whose stars are less well known.To examine his belief he records the gross revenue and the payment (in $ millions) given to the two highest-paid performers in the play for ten recently staged plays.
 -{Theatre Revenues Narrative} Estimate the gross revenue of a play if the two highest paid performers received 6 million dollars.
(Essay)
4.8/5 (35)
Oil Quality and Price
Quality of oil is measured in API gravity degrees--the higher the degrees API, the higher the quality.The table shown below is produced by an expert in the field who believes that there is a relationship between quality and price per barrel.
 A partial Minitab output follows:


 -{Oil Quality and Price Narrative} Use the predicted values and the actual values of y to calculate the residuals.
(Essay)
4.8/5 (34)
Wayne Newton Concert
At a recent Wayne Newton concert, a survey was conducted that asked a random sample of 20 people their age and how many concerts they have attended since the first of the year.The following data were collected:
 An Excel output follows:
 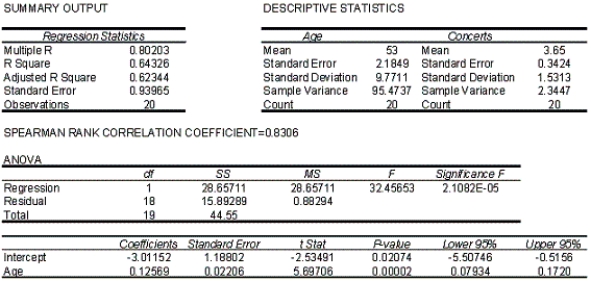 -{Wayne Newton Concert Narrative} Estimate with 95% confidence the average number of concerts attended by all 45 year-old individuals.
(Essay)
4.8/5 (37)
If the coefficient of correlation is -0.60, then the coefficient of determination is:
(Multiple Choice)
4.8/5 (40)
If the error variable  is normally distributed, the test statistic for testing H0: 1 = 0 has a Student t-distribution with n - 2 degrees of freedom.
(True/False)
4.9/5 (38)
If the coefficient of determination is 0.975, then which of the following is true regarding the slope of the regression line?
(Multiple Choice)
4.8/5 (30)
In regression analysis, if the coefficient of determination is 1.0, then:
(Multiple Choice)
4.9/5 (41)
Movie Revenues
A financier whose specialty is investing in movie productions has observed that, in general, movies with "big-name" stars seem to generate more revenue than those movies whose stars are less well known.To examine his belief he records the gross revenue and the payment (in $ millions) given to the two highest-paid performers in the movie for ten recently released movies.
 -{Movie Revenues Narrative} Estimate with 95% confidence the average gross revenue of a movie whose top two stars earn $5.0 million.
(Essay)
4.9/5 (37)
The confidence interval estimate of the expected value of y for a given value x, compared to the prediction interval of y for the same given value of x and confidence level, will be:
(Multiple Choice)
4.9/5 (31)
The graph of a confidence interval for the expected value of y is represented by two parallel lines, one on either side of the regression line.
(True/False)
4.8/5 (39)
Theatre Revenues
A financier whose specialty is investing in stage productions has observed that, in general, movies with "big-name" stars seem to generate more revenue than those plays whose stars are less well known.To examine his belief he records the gross revenue and the payment (in $ millions) given to the two highest-paid performers in the play for ten recently staged plays.
-{Theatre Revenues Narrative} Draw a scatter diagram of the data.Comment on whether it appears that a linear model might be appropriate.
(Essay)
4.8/5 (34)
A regression analysis between sales (in $) and advertising (in $) resulted in the following least squares line:  .This implies that an increase of $1 in advertising is associated with an increase of $60 in sales.
(True/False)
4.8/5 (23)
Which of the following statistics and procedures can be used to determine whether a linear model should be employed?
(Multiple Choice)
4.8/5 (43)
If the standard error of estimate  = 20 and n = 10, then the sum of squares for error, SSE, is:
(Multiple Choice)
4.8/5 (35)
If the coefficient of determination is 1.0, then the coefficient of correlation must be 1.0.
(True/False)
5.0/5 (34)
The symbol for the population coefficient of correlation is:
(Multiple Choice)
4.8/5 (30)
Statisticians have shown that sample y-intercept b0 and sample slope coefficient b1 are unbiased estimators of the population regression parameters 0 and 1, respectively.
(True/False)
4.7/5 (31)
To create a deterministic model, we start with a probabilistic model that approximates the relationship we want to model.
(True/False)
4.8/5 (39)
Filters
- Essay(0)
- Multiple Choice(0)
- Short Answer(0)
- True False(0)
- Matching(0)