Exam 16: Simple Linear Regression and Correlation
Exam 1: What Is Statistics43 Questions
Exam 2: Graphical Descriptive Techniques I93 Questions
Exam 3: Graphical Descriptive Techniques II183 Questions
Exam 4: Numerical Descriptive Techniques274 Questions
Exam 5: Data Collection and Sampling82 Questions
Exam 6: Probability234 Questions
Exam 7: Random Variables and Discrete Probability Distributions274 Questions
Exam 8: Continuous Probability Distributions215 Questions
Exam 9: Sampling Distributions153 Questions
Exam 10: Introduction to Estimation152 Questions
Exam 11: Introduction to Hypothesis Testing182 Questions
Exam 12: Inference About a Population147 Questions
Exam 13: Inference About Comparing Two Populations170 Questions
Exam 14: Analysis of Variance153 Questions
Exam 15: Chi-Squared Tests175 Questions
Exam 16: Simple Linear Regression and Correlation298 Questions
Exam 17: Multiple Regression157 Questions
Select questions type
In the simple linear regression model, the y-intercept represents the:
(Multiple Choice)
4.7/5  (22)
(22)
In a regression problem, if the coefficient of determination is 0.95, this means that:
(Multiple Choice)
4.8/5 (38)
Marc Anthony Concert
At a recent Marc Anthony concert, a survey was conducted that asked a random sample of 20 people their age and how many concerts they have attended since the first of the year.The following data were collected:
 An Excel output follows:
 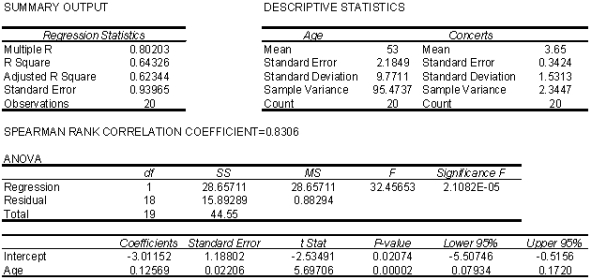 -{Marc Anthony Concert Narrative} Identify possible outliers.
(Essay)
5.0/5 (26)
Oil Quality and Price
Quality of oil is measured in API gravity degrees--the higher the degrees API, the higher the quality.The table shown below is produced by an expert in the field who believes that there is a relationship between quality and price per barrel.
 A partial Minitab output follows:


 -{Oil Quality and Price Narrative} Use the residuals to compute the standardized residuals.
(Essay)
4.9/5 (35)
Suppose the slope of a simple linear regression line between hours studying and exam score is 5.That means as ____________________ increases by one, ____________________ increases by 5.
(Short Answer)
4.9/5 (32)
In a simple linear regression problem, the following sum of squares are produced: 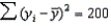 ,
, 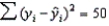 , and
, and 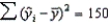 .The percentage of the variation in y that is explained by the variation in x is:
(Multiple Choice)
5.0/5 (43)
For a regression analysis to be valid, the error variable must have a(n) ____________________ distribution.
(Short Answer)
4.9/5 (38)
The degrees of freedom for the test statistic for the slope is ____________________.
(Short Answer)
4.8/5 (27)
If the coefficient of correlation is 1.0, then the coefficient of determination must be 1.0.
(True/False)
4.9/5 (20)
If a single point has a large impact on the equation of the regression line, it is called a(n) ____________________ point.
(Short Answer)
5.0/5 (36)
Cost of Textbooks
The editor of a higher education book publisher claims that a large part of the cost of books is the cost of paper.This implies that larger textbooks will cost more money.As an experiment to analyze the claim, a university student visits the bookstore and records the number of pages and the selling price of twelve randomly selected textbooks.These data are listed below.
 -{Cost of Textbooks Narrative} Draw a scatter diagram of the data.Comment on whether it appears that a linear model might be appropriate.
(Essay)
4.7/5 (40)
In a simple linear regression model b1 is the ____________________ of the straight line.
(Short Answer)
4.8/5 (32)
Comedy Shows Revenues
A financier whose specialty is investing in comedy shows has observed that, in general, shows with "big-name" stars seem to generate more revenue than those shows whose stars are less well known.To examine his belief he records the gross revenue and the payment (in $ millions) given to the two highest-paid comedians in the show for ten recently staged shows.
 -{Comedy Shows Revenues Narrative} Plot the residuals against the predicted values of y.What does the graph tell you?
(Essay)
4.8/5 (31)
Sales and Experience
The general manager of a chain of department stores believes that experience is the most important factor in determining the level of success of a salesperson.To examine this belief she records last month's sales (in $1,000s) and the years of experience of 10 randomly selected salespeople.These data are listed below.
 -{Sales and Experience Narrative} Determine the least squares regression line.
(Essay)
4.9/5 (35)
Marc Anthony Concert
At a recent Marc Anthony concert, a survey was conducted that asked a random sample of 20 people their age and how many concerts they have attended since the first of the year.The following data were collected:
An Excel output follows:
-{Marc Anthony Concert Narrative} Does it appear that heteroscedasticity is a problem? Explain.
(Essay)
4.8/5 (32)
Telemarketing Sales and Experience
The general manager of a telemarketing company believes that experience is the most important factor in determining the level of success of a telemarketer.To examine this belief she records last month's sales (in $1,000s) and the years of experience of 10 randomly selected telemarketers.These data are listed below.
 -{Telemarketer Sales and Experience Narrative} Plot the residuals against the predicted values of y.What does the graph tell you?
(Essay)
4.8/5 (34)
Filters
- Essay(0)
- Multiple Choice(0)
- Short Answer(0)
- True False(0)
- Matching(0)