Exam 9: Hypothesis Testing
(A) Construct a 90% confidence interval for the difference between the proportions of unacceptable assemblies generated by the two teams.
(B) Based on the confidence interval constructed in (A), is there sufficient evidence to conclude, at the 10% significance level, that the two teams differ with respect to their proportions of unacceptable assemblies?
(C) Is there sufficient evidence to conclude, at the 10% significance level, that the two teams differ with respect to their proportions of unacceptable assemblies? Conduct the appropriate hypothesis test.
(D) Calculate the p-value and explain how to use it for testing the null hypothesis of equal proportion.
(A) 
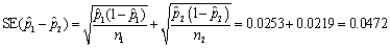
 →(-0.0382,0.117)
(B) Because the 90% confidence interval includes the value 0, we cannot reject the null hypothesis of equal proportions. Therefore, there is sufficient evidence to conclude, at the 10% significance level, that the two teams differ with respect to their proportions of unacceptable assemblies
(C)

 = (15 + 8) / (145 + 125) = 0.0852
 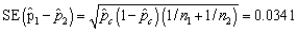 Z - value =
 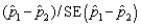 = 0.0394 / 0.0341 = 1.155
Critical values =  Since z-value does not fall in the rejection region, we cannot reject
  at the 10% significance level. Therefore, there is no sufficient evidence to conclude, at the 10% significance level, that the two teams differ with respect to their proportions of unacceptable assemblies
(D) p-value = 2p(Z >1.155) =2(0.124) = 0.248
Since p-value=0.248 >  =0.10, we cannot reject
Do graduates of undergraduate business programs with different majors tend to earn disparate starting salaries? Below you will find output from an analysis for randomly selected graduates with majors in accounting (Acct) and marketing (Mktg). 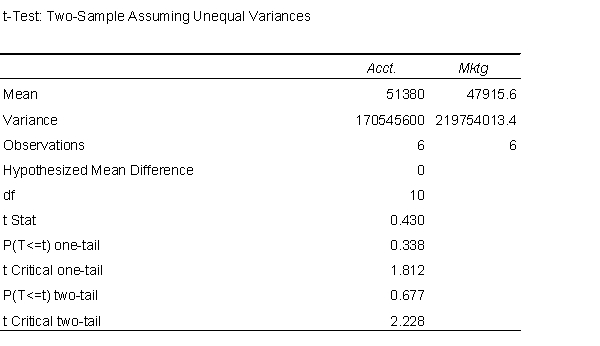 -Assuming that the variances of the underlying populations are unequal, can you reject at a 5% significance level that the mean starting salaries for accounting and marketing majors are the same? Explain why or why not.
(A)  The salaries are equal.
  The salaries are not equal.
Because the p - value = 0.667 <  = 0.05, we cannot reject
  and conclude that in this test the difference between the salaries is not statistically significant.
If a null hypothesis about a population mean  is rejected at the 0.025 level of significance, then it must also be rejected at the 0.01 level.
False
A test for independence is applied to a contingency table with 4 rows and 4 columns. The degrees of freedom for this chi-square test must equal 9.
Do undergraduate business students who major in information systems (IS) earn, on average, higher annual starting salaries than their peers who major in marketing (Mktg)? To address this question with a statistical hypothesis test, a comparison should be done to determine whether the variances of annual starting salaries of the two types of majors are equal. Below you will find output from a test of 20 randomly selected IS majors and 20 randomly selected Mktg majors. 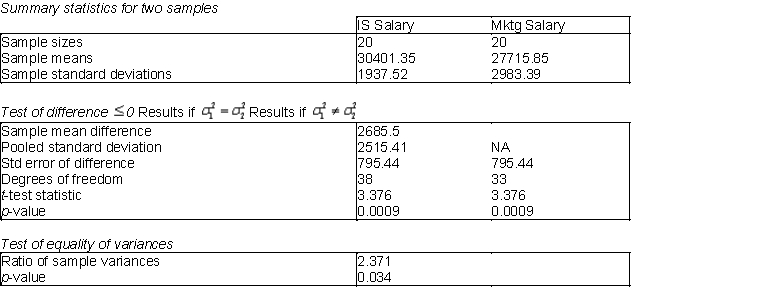 -(A) Use the information above to perform the test of equal variance. Explain how the ratio of sample variances is calculated. What type of distribution is used to test for equal variances? Also, would you conclude that the variances are equal or not? Explain.
(B) Based on your conclusion in (A), which test statistic should be used in performing a test for the existence of a difference between population means?
(C) Using a 5% level of significance, is there sufficient evidence to conclude that IS majors earn, on average, a higher annual starting salaries than their peers who major in Mktg?
(D) Using a 1% level of significance, is there sufficient evidence to conclude that IS majors earn, on average, a higher annual starting salaries than their peers who major in Mktg? Explain your answer.
-(A) Use the information above to perform the test of equal variance. Explain how the ratio of sample variances is calculated. What type of distribution is used to test for equal variances? Also, would you conclude that the variances are equal or not? Explain.
(B) Based on your conclusion in (A), which test statistic should be used in performing a test for the existence of a difference between population means?
(C) Using a 5% level of significance, is there sufficient evidence to conclude that IS majors earn, on average, a higher annual starting salaries than their peers who major in Mktg?
(D) Using a 1% level of significance, is there sufficient evidence to conclude that IS majors earn, on average, a higher annual starting salaries than their peers who major in Mktg? Explain your answer.
What is the idea behind the chi-square test for independence?
A recent study of educational levels of 1000 voters and their political party affiliations in a Midwestern state showed the results given in the table below. Use  = .10 and test to determine if party affiliation is independent of the educational level of the voters.
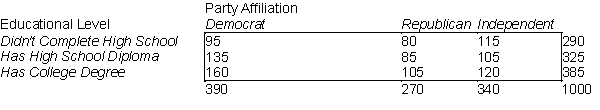
(A) State the appropriate null and alternative hypotheses in this situation.
(B) Test this CEO's belief at the  =.05 significance level and report the p-value. Do you find statistical support for his hypothesis that the proportion of women in similar sales positions across the country is less than 40%?
(C) Suppose the sample size above is 100, instead of 50, and the sample proportion is again 0.36. Would this change your results? Explain your answer.
=.05 significance level and report the p-value. Do you find statistical support for his hypothesis that the proportion of women in similar sales positions across the country is less than 40%?
(C) Suppose the sample size above is 100, instead of 50, and the sample proportion is again 0.36. Would this change your results? Explain your answer.
Lilliefors test for normality compare two cumulative distribution functions (cdf's): the cdf from a normal distribution and the cdf corresponding to the given data (called the empirical cdf).
Which of the following statements are true of the null and alternative hypotheses?
The number of cars sold by three salespersons over a 6-month period are shown in the table below. Use the 5% level of significance to test for independence of salespersons and type of car sold. 
A Type I error probability is represented by  ; it is the probability of incorrectly rejecting a null hypothesis that is true.
Filters
- Essay(0)
- Multiple Choice(0)
- Short Answer(0)
- True False(0)
- Matching(0)