Exam 10: Regression Analysis: Estimating Relationships
Exam 1: Introduction to Business Analytics29 Questions
Exam 2: Describing the Distribution of a Single Variable100 Questions
Exam 3: Finding Relationships Among Variables85 Questions
Exam 4: Probability and Probability Distributions114 Questions
Exam 5: Normal, Binomial, Poisson, and Exponential Distributions125 Questions
Exam 6: Decision Making Under Uncertainty107 Questions
Exam 7: Sampling and Sampling Distributions90 Questions
Exam 8: Confidence Interval Estimation84 Questions
Exam 9: Hypothesis Testing87 Questions
Exam 10: Regression Analysis: Estimating Relationships92 Questions
Exam 11: Regression Analysis: Statistical Inference82 Questions
Exam 12: Time Series Analysis and Forecasting106 Questions
Exam 13: Introduction to Optimization Modeling97 Questions
Exam 14: Optimization Models114 Questions
Exam 15: Introduction to Simulation Modeling82 Questions
Exam 16: Simulation Models102 Questions
Exam 17: Data Mining20 Questions
Exam 18: Importing Data Into Excel19 Questions
Exam 19: Analysis of Variance and Experimental Design20 Questions
Exam 20: Statistical Process Control20 Questions
Select questions type
Which of the following is an example of a nonlinear regression model?
Free
(Multiple Choice)
4.8/5  (42)
(42)
Correct Answer: Verified
E
In linear regression, the fitted value is:
Free
(Multiple Choice)
4.9/5 (43)
Correct Answer:Verified
A
We should include an interaction variable in a regression model if we believe that the effect of one explanatory variable  on the response variable Y depends on the value of another explanatory variable
  .
.
Free
(True/False)
4.7/5 (32)
Correct Answer:Verified
True
In regression analysis, if there are several explanatory variables, it is called:
(Multiple Choice)
4.8/5 (27)
In regression analysis, which of the following causal relationships are possible?
(Multiple Choice)
4.9/5 (33)
In every regression study there is a single variable that we are trying to explain or predict. This is called the response variable or dependent variable.
(True/False)
4.8/5 (25)
In a simple linear regression analysis, the following sums of squares are produced:  The proportion of the variation in Y that is explained by the variation in X is:
(Multiple Choice)
4.9/5 (34)
The coefficients for logarithmically transformed explanatory variables should be interpreted as the percent change in the dependent variable for a 1% percent change in the explanatory variable.
(True/False)
5.0/5 (36)
An important condition when interpreting the coefficient for a particular independent variable X in a multiple regression equation is that:
(Multiple Choice)
4.7/5 (30)
The R2 can only increase when extra explanatory variables are added to a multiple regression model.
(True/False)
4.9/5 (26)
In regression analysis, the variables used to help explain or predict the response variable are called the:
(Multiple Choice)
4.7/5 (29)
In simple linear regression, the divisor of the standard error of estimate  is n - 1, simply because there is only one explanatory variable of interest.
(True/False)
4.8/5 (39)
A regression analysis between sales (in $1000) and advertising (in $100) resulted in the following least squares line:  = 84 +7X. This implies that if there is no advertising, then the predicted amount of sales (in dollars) is $84,000.
(True/False)
4.9/5 (39)
Approximately what percentage of the observed Y values are within one standard error of the estimate (  ) of the corresponding fitted Y values?
(Multiple Choice)
4.8/5 (36)
The station manager of a local television station is interested in predicting the amount of television (in hours) that people will watch in the viewing area. The explanatory variables are:  age (in years),
  education (highest level obtained, in years) and
  family size (number of family members in household). The multiple regression output is shown below:
 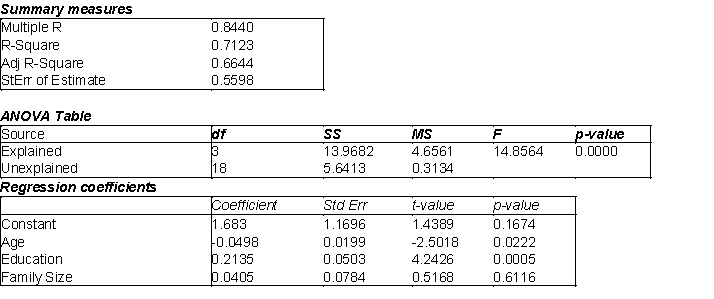 -(A) Use the information above to estimate the linear regression model.
(B) Interpret each of the estimated regression coefficients of the regression model in (A).
(C) Identify and interpret the coefficient of determination (
-(A) Use the information above to estimate the linear regression model.
(B) Interpret each of the estimated regression coefficients of the regression model in (A).
(C) Identify and interpret the coefficient of determination (  ) for the model in (A).
(D) Identify and interpret the standard error of the estimate
) for the model in (A).
(D) Identify and interpret the standard error of the estimate  for the model in (A).
(Essay)
4.9/5 (30)
Filters
- Essay(0)
- Multiple Choice(0)
- Short Answer(0)
- True False(0)
- Matching(0)