Exam 11: Regression Analysis: Statistical Inference
Exam 1: Introduction to Business Analytics29 Questions
Exam 2: Describing the Distribution of a Single Variable100 Questions
Exam 3: Finding Relationships Among Variables85 Questions
Exam 4: Probability and Probability Distributions114 Questions
Exam 5: Normal, Binomial, Poisson, and Exponential Distributions125 Questions
Exam 6: Decision Making Under Uncertainty107 Questions
Exam 7: Sampling and Sampling Distributions90 Questions
Exam 8: Confidence Interval Estimation84 Questions
Exam 9: Hypothesis Testing87 Questions
Exam 10: Regression Analysis: Estimating Relationships92 Questions
Exam 11: Regression Analysis: Statistical Inference82 Questions
Exam 12: Time Series Analysis and Forecasting106 Questions
Exam 13: Introduction to Optimization Modeling97 Questions
Exam 14: Optimization Models114 Questions
Exam 15: Introduction to Simulation Modeling82 Questions
Exam 16: Simulation Models102 Questions
Exam 17: Data Mining20 Questions
Exam 18: Importing Data Into Excel19 Questions
Exam 19: Analysis of Variance and Experimental Design20 Questions
Exam 20: Statistical Process Control20 Questions
Select questions type
A backward procedure is a type of equation building procedure that begins with all potential explanatory variables in the regression equation and deletes them two at a time until further deletion would reduce the percentage of variation explained to a value less than 0.50.
Free
(True/False)
4.8/5  (25)
(25)
Correct Answer: Verified
False
Multicollinearity is a situation in which two or more of the explanatory variables are highly correlated with each other.
Free
(True/False)
4.7/5 (30)
Correct Answer:Verified
True
In a multiple regression analysis involving 4 explanatory variables and 40 data points, the degrees of freedom associated with the sum of squared errors, SSE, is 35.
Free
(True/False)
4.8/5 (41)
Correct Answer:Verified
True
An Internet-based retail company that specializes in audio and visual equipment is interested in creating a model to determine the amount of money, in dollars, its customers will spend purchasing products from them in the coming year. In order to create a reliable model, this company has tracked a number of variables on its customers. Below you will find the Excel output related to several of these variables. This company has tried using the customer's annual salary for entire household  , the number of children in the household
  , and if the customer purchased merchandise from them in the previous year (
  in 2015).
 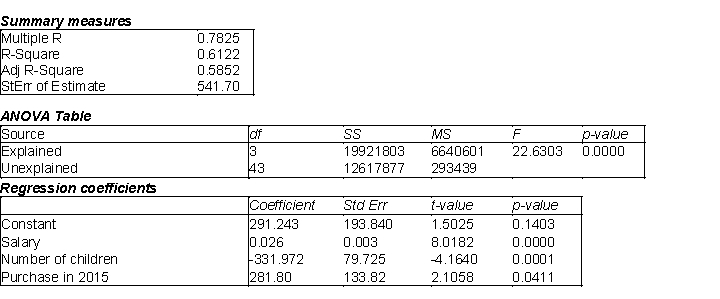 -(A) Estimate the regression model. How well does this model fit the data?
(B) Is there a linear relationship between the explanatory variables and the dependent variable? Explain how you arrived at your answer at the 5% significance level.
(C) Use the estimated regression model to predict the amount of money a customer will spend if their annual salary is $45,000, they have 1 child and they were a customer that purchased merchandise in the previous year (2015).
(D) Find a 95% prediction interval for the point prediction calculated in (C). Use a t-multiple = 2.02.
(E) Find a 95% confidence interval for the amount of money spent by all customers sharing the characteristics described in (C). Use a t-multiple = 2.02.
(F) How do you explain the differences between the widths of the intervals in (D) and (E)?
-(A) Estimate the regression model. How well does this model fit the data?
(B) Is there a linear relationship between the explanatory variables and the dependent variable? Explain how you arrived at your answer at the 5% significance level.
(C) Use the estimated regression model to predict the amount of money a customer will spend if their annual salary is $45,000, they have 1 child and they were a customer that purchased merchandise in the previous year (2015).
(D) Find a 95% prediction interval for the point prediction calculated in (C). Use a t-multiple = 2.02.
(E) Find a 95% confidence interval for the amount of money spent by all customers sharing the characteristics described in (C). Use a t-multiple = 2.02.
(F) How do you explain the differences between the widths of the intervals in (D) and (E)?
(Essay)
4.8/5 (30)
An error term represents the vertical distance from any point to the:
(Multiple Choice)
4.8/5 (37)
The owner of a pizza restaurant chain would like to predict the sales of her recent specialty, a Mediterranean flatbread pizza. She has gathered data on monthly sales of the Mediterranean flatbread pizza at her restaurants. She has also gathered information related to the average price of flatbread pizzas, the monthly advertising expenditures, and the disposable income per household in the areas surrounding the restaurants. Below you will find output from the stepwise regression analysis. The p-value method was used with a cutoff of 0.05. 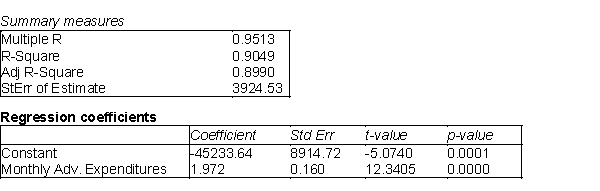 -(A) Summarize the findings of the stepwise regression method using this cutoff value.
(B) When the cutoff value was increased to 0.10, the output below was the result. The table at top left represents the change when the disposable income variable is added to the model and the table at top right represents the average price variable being added. The regression model with both added variables is shown in the bottom table. Summarize the results for this model.
-(A) Summarize the findings of the stepwise regression method using this cutoff value.
(B) When the cutoff value was increased to 0.10, the output below was the result. The table at top left represents the change when the disposable income variable is added to the model and the table at top right represents the average price variable being added. The regression model with both added variables is shown in the bottom table. Summarize the results for this model. 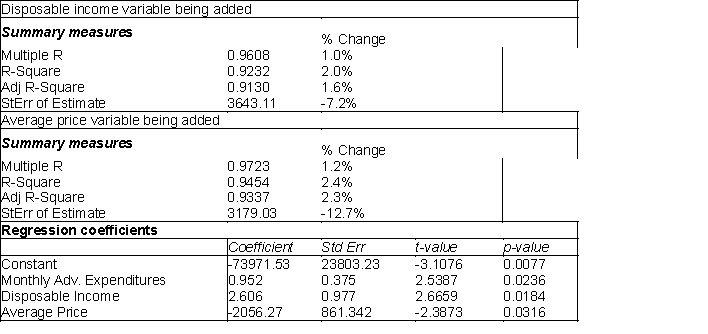 (C) Which model would you recommend using? Why?
(Essay)
5.0/5 (40)
In a simple linear regression model, testing whether the slope  of the population regression line could be zero is the same as testing whether or not the linear relationship between the response variable Y and the explanatory variable X is significant.
(True/False)
4.7/5 (38)
The owner of a large chain of health spas has selected eight of her smaller clubs for a test in which she varies the size of the newspaper ad  , and the amount of the initiation fee discount
  to see how this might affect the number of prospective members who visit each club during the following week. The results are shown in the table below:
 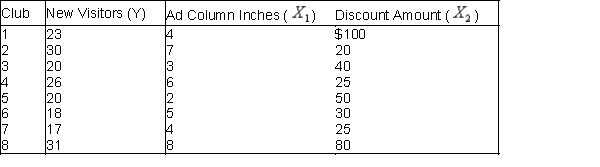 The results of a multiple regression analysis are below.
 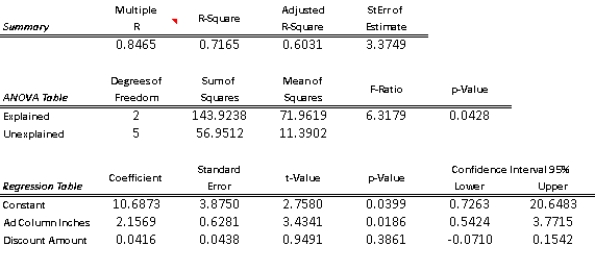 -(A) Determine the least-squares multiple regression equation.
(B) Interpret the Y-intercept of the regression equation.
(C) Interpret the partial regression coefficients.
(D) What is the estimated number of new visitors to a club if the size of the ad is 6 column-inches and a $100 discount is offered?
(E) Determine the approximate 95% prediction interval for the number of new visitors to a given club when the ad is 5 column-inches and the discount is $80.
(F) What is the value for the percentage of variation explained, and exactly what does it indicate?
(G) At the 0.05 level, is the overall regression equation in (A) significant?
(H) Use the 0.05 level in concluding whether each partial regression coefficient differs significantly from zero.
(I Interpret the results of the preceding tests in (H) and (I) in the context of the two explanatory variables described in the problem.
(J) Construct a 95% confidence interval for each partial regression coefficient in the population regression equation.
-(A) Determine the least-squares multiple regression equation.
(B) Interpret the Y-intercept of the regression equation.
(C) Interpret the partial regression coefficients.
(D) What is the estimated number of new visitors to a club if the size of the ad is 6 column-inches and a $100 discount is offered?
(E) Determine the approximate 95% prediction interval for the number of new visitors to a given club when the ad is 5 column-inches and the discount is $80.
(F) What is the value for the percentage of variation explained, and exactly what does it indicate?
(G) At the 0.05 level, is the overall regression equation in (A) significant?
(H) Use the 0.05 level in concluding whether each partial regression coefficient differs significantly from zero.
(I Interpret the results of the preceding tests in (H) and (I) in the context of the two explanatory variables described in the problem.
(J) Construct a 95% confidence interval for each partial regression coefficient in the population regression equation.
(Essay)
4.7/5 (37)
The value of the sum of squares due to regression, SSR, can never be larger than the value of the sum of squares total, SST.
(True/False)
4.8/5 (33)
Many companies manufacture products that are at least partially produced using chemicals (for example, paint). In many cases, the quality of the finished product is a function of the temperature and pressure at which the chemical reactions take place. Suppose that a particular manufacturer in Texas wants to model the quality (Y) of a product as a function of the temperature  and the pressure
  at which it is produced. The table below contains data obtained from a designed experiment involving these variables. Note that the assigned quality score can range from a minimum of 0 to a maximum of 100 for each manufactured product.
 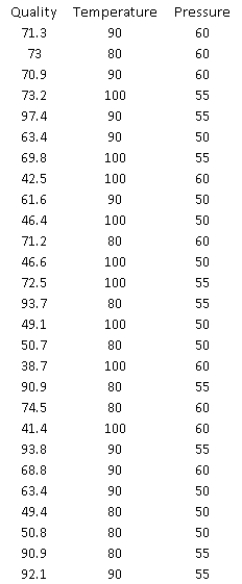 -(A) Estimate a multiple regression model that includes the two given explanatory variables. Assess this set of explanatory variables with an F-test, and report a p-value.
(B) Identify and interpret the percentage of variance explained for the model in (A).
(C) Identify and interpret the percentage of variance explained for the model in (B).
(D) Which regression equation is the most appropriate one for modeling the quality of the given product? Bear in mind that a good statistical model is usually parsimonious.
-(A) Estimate a multiple regression model that includes the two given explanatory variables. Assess this set of explanatory variables with an F-test, and report a p-value.
(B) Identify and interpret the percentage of variance explained for the model in (A).
(C) Identify and interpret the percentage of variance explained for the model in (B).
(D) Which regression equation is the most appropriate one for modeling the quality of the given product? Bear in mind that a good statistical model is usually parsimonious.
(Essay)
5.0/5 (35)
What is not one of the guidelines for including/excluding variables in a regression equation?
(Multiple Choice)
4.9/5 (44)
Multiple regression represents an improvement over simple regression because it allows any number of response variables to be included in the analysis.
(True/False)
4.8/5 (35)
A local truck rental company wants to use regression to predict the yearly maintenance expense (Y), in dollars, for a truck using the number of miles driven during the year  and the age of the truck in years
  at the beginning of the year. To examine the relationship, the company has gathered the data on 15 trucks and regression analysis has been conducted. The regression output is presented below.
 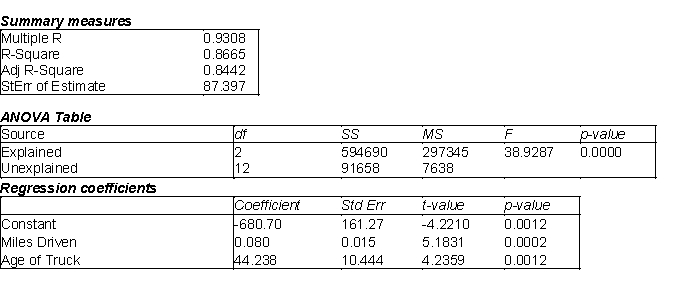 -(A) Estimate the regression model. How well does this model fit the given data?
(B) Is there a linear relationship between the two explanatory variables and the dependent variable at the 5% significance level? Explain how you arrived at your answer.
(C) Use the estimated regression model to predict the annual maintenance expense of a truck that is driven 14,000 miles per year and is 5 years old.
(D) Find a 95% prediction interval for the maintenance expense determined in (C). Use a t-multiple = 2.
(E) Find a 95% confidence interval for the maintenance expense for all trucks sharing the characteristics provided in (C). Use a t-multiple = 2.
(F) How do you explain the differences between the widths of the intervals in (D) and (E)?
-(A) Estimate the regression model. How well does this model fit the given data?
(B) Is there a linear relationship between the two explanatory variables and the dependent variable at the 5% significance level? Explain how you arrived at your answer.
(C) Use the estimated regression model to predict the annual maintenance expense of a truck that is driven 14,000 miles per year and is 5 years old.
(D) Find a 95% prediction interval for the maintenance expense determined in (C). Use a t-multiple = 2.
(E) Find a 95% confidence interval for the maintenance expense for all trucks sharing the characteristics provided in (C). Use a t-multiple = 2.
(F) How do you explain the differences between the widths of the intervals in (D) and (E)?
(Essay)
4.8/5 (36)
In multiple regressions, if the F-ratio is large, the explained variation is large relative to the unexplained variation.
(True/False)
4.8/5 (38)
When the error variance is nonconstant, it is common to see the variation increases as the explanatory variable increases (you will see a "fan shape" in the scatterplot). There are two ways you can deal with this phenomenon. These are:
(Multiple Choice)
4.9/5 (43)
A researcher can check whether the errors are normally distributed by using:
(Multiple Choice)
5.0/5 (37)
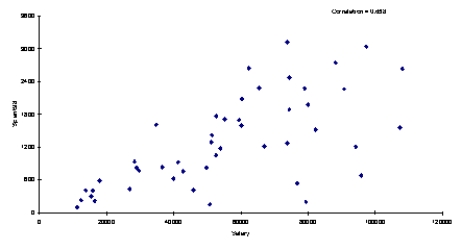
Below you will find a scatterplot of data gathered by an online retail company. The company has been able to obtain the annual salaries of their customers and the amount that each of these customers spent on the company's site last year. Based on the scatterplot below, would you conclude that these data meet all four assumptions of regression? Explain your answer.
(Essay)
4.7/5 (35)
Determining which variables to include in regression analysis by estimating a series of regression equations by successively adding or deleting variables according to prescribed rules is referred to as:
(Multiple Choice)
4.9/5 (37)
Filters
- Essay(0)
- Multiple Choice(0)
- Short Answer(0)
- True False(0)
- Matching(0)