Exam 12: Time Series Analysis and Forecasting
Exam 1: Introduction to Business Analytics29 Questions
Exam 2: Describing the Distribution of a Single Variable100 Questions
Exam 3: Finding Relationships Among Variables85 Questions
Exam 4: Probability and Probability Distributions114 Questions
Exam 5: Normal, Binomial, Poisson, and Exponential Distributions125 Questions
Exam 6: Decision Making Under Uncertainty107 Questions
Exam 7: Sampling and Sampling Distributions90 Questions
Exam 8: Confidence Interval Estimation84 Questions
Exam 9: Hypothesis Testing87 Questions
Exam 10: Regression Analysis: Estimating Relationships92 Questions
Exam 11: Regression Analysis: Statistical Inference82 Questions
Exam 12: Time Series Analysis and Forecasting106 Questions
Exam 13: Introduction to Optimization Modeling97 Questions
Exam 14: Optimization Models114 Questions
Exam 15: Introduction to Simulation Modeling82 Questions
Exam 16: Simulation Models102 Questions
Exam 17: Data Mining20 Questions
Exam 18: Importing Data Into Excel19 Questions
Exam 19: Analysis of Variance and Experimental Design20 Questions
Exam 20: Statistical Process Control20 Questions
Select questions type
In a moving averages method, which of the following represent(s) the number of terms in the moving average?
Free
(Multiple Choice)
4.9/5  (32)
(32)
Correct Answer: Verified
D
A linear trend means that the time series variable changes by a:
Free
(Multiple Choice)
4.8/5 (37)
Correct Answer:Verified
A
Suppose that simple exponential smoothing with  is used to forecast monthly Pepsi sales at a small grocery store. After March's demand is observed, the forecasted demand for April is 5000 cans of Pepsi.
-At the beginning of April, what is the forecast of June's Pepsi sales?
is used to forecast monthly Pepsi sales at a small grocery store. After March's demand is observed, the forecasted demand for April is 5000 cans of Pepsi.
-At the beginning of April, what is the forecast of June's Pepsi sales?
Free
(Essay)
4.8/5 (36)
Correct Answer:Verified
Forecast for June is 5000 cans.
If a random series has too few runs, then it is zigzagging too often.
(True/False)
4.8/5 (39)
The data shown below contains the monthly sales (in thousands of dollars) at a local department store for each of the past 24 months. 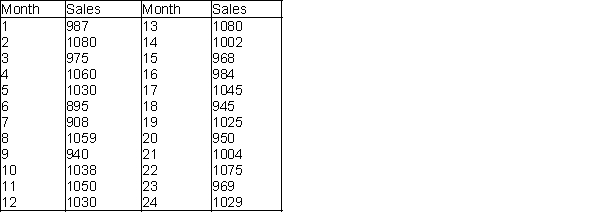 -(A) Develop a time series plot of the data.
(B) Perform a runs test and compute a few autocorrelations to determine whether this time series is random.
(C) Given your answers to (A) and (B), what type of forecast do you recommend? Explain your answer.
(D) Use your answer to (C), to obtain a forecast for the next quarter (4 months). How reliable do you think this forecast is?
-(A) Develop a time series plot of the data.
(B) Perform a runs test and compute a few autocorrelations to determine whether this time series is random.
(C) Given your answers to (A) and (B), what type of forecast do you recommend? Explain your answer.
(D) Use your answer to (C), to obtain a forecast for the next quarter (4 months). How reliable do you think this forecast is?
(Essay)
4.8/5 (31)
If the observations of a time series increase or decrease regularly through time, we say that the time series has a random (or noise) component.
(True/False)
4.8/5 (31)
In a multiplicative seasonal model, we multiply a "base" forecast by an appropriate seasonal index. These indexes, one for each season, typically average to 1.
(True/False)
4.8/5 (32)
Forecasting models can be divided into three groups. They are:
(Multiple Choice)
4.8/5 (32)
The quarterly numbers of applications for home mortgage loans at a branch office of a large bank are recorded in the table below. 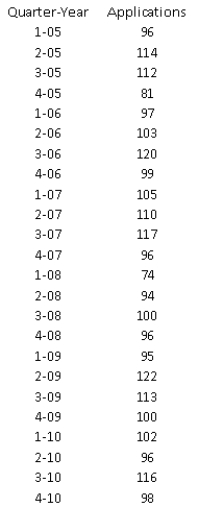 -Analysts are looking at data in select technology industries during the first decade of the century before forecasting possible trends in the second decade. Below is data for startups in one industry in the years 2005-2010.
(A) Perform a runs test and compute a few autocorrelations to determine whether this time series is random.
(B) Obtain a time series chart. Which of the exponential smoothing models do you think should be used for forecasting based on this chart? Why?
(C) Use simple exponential smoothing to forecast these data, using no holdout period and requesting 4 quarters of future forecasts. Use the default smoothing constant of 0.10.
(D) Repeat (C), optimizing the smoothing constant. Does it make much of an improvement?
-Analysts are looking at data in select technology industries during the first decade of the century before forecasting possible trends in the second decade. Below is data for startups in one industry in the years 2005-2010.
(A) Perform a runs test and compute a few autocorrelations to determine whether this time series is random.
(B) Obtain a time series chart. Which of the exponential smoothing models do you think should be used for forecasting based on this chart? Why?
(C) Use simple exponential smoothing to forecast these data, using no holdout period and requesting 4 quarters of future forecasts. Use the default smoothing constant of 0.10.
(D) Repeat (C), optimizing the smoothing constant. Does it make much of an improvement?
(Essay)
4.7/5 (27)
The runs test is a formal test of the null hypothesis of randomness. If there are too many or too few runs in the series, then we conclude that the series is not random.
(True/False)
4.8/5 (35)
The runs test uses a series of 0's and 1's. The 0's and 1's typically represent whether each observation is:
(Multiple Choice)
4.8/5 (33)
Winter's method is an exponential smoothing method, which is appropriate for a series with trend but no seasonality.
(True/False)
5.0/5 (36)
The table below contains 5 years of monthly data on sales (number of units sold) for a particular company, in addition to extra columns containing information needed to answer some of the questions. The company suspects that except for random noise, its sales are growing by a constant percentage each month and that they will continue to do so for at least the near future. 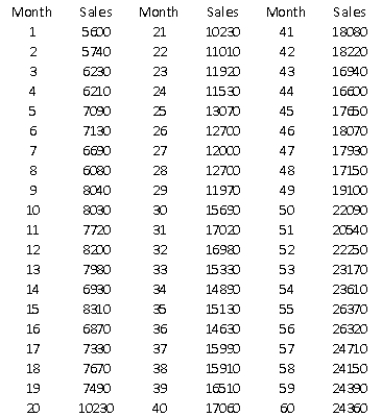 -Explain briefly whether the plot of the series visually supports the company's suspicion.
(Essay)
4.8/5 (33)
In a regression model with seasonal dummy variables, the coefficients on the dummy variables represent the additive factor relative to the reference quarter value, not the multiplicative factor.
(True/False)
4.9/5 (29)
The moving average method is perhaps the simplest and one of the most frequently-used extrapolation methods.
(True/False)
4.8/5 (31)
A small sporting goods store is reviewing its sales data over the past decade to determine whether or not to open a new location. The data shown below contains total monthly retail sales (in dollars) for the years 2006-2008, the first three years of its business. 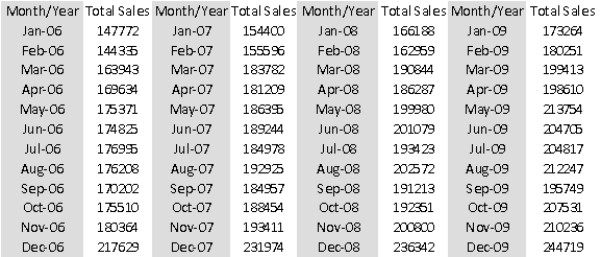 -Obtain a time series graph of the data. If you will be using a moving average model of the data, what information does this graph provide to help specify such a model?
(Essay)
4.8/5 (29)
Perform a runs test and compute a few autocorrelations to determine whether this time series is random.
(Essay)
5.0/5 (42)
Filters
- Essay(0)
- Multiple Choice(0)
- Short Answer(0)
- True False(0)
- Matching(0)