Exam 2: Describing the Distribution of a Single Variable
Exam 1: Introduction to Business Analytics29 Questions
Exam 2: Describing the Distribution of a Single Variable100 Questions
Exam 3: Finding Relationships Among Variables85 Questions
Exam 4: Probability and Probability Distributions114 Questions
Exam 5: Normal, Binomial, Poisson, and Exponential Distributions125 Questions
Exam 6: Decision Making Under Uncertainty107 Questions
Exam 7: Sampling and Sampling Distributions90 Questions
Exam 8: Confidence Interval Estimation84 Questions
Exam 9: Hypothesis Testing87 Questions
Exam 10: Regression Analysis: Estimating Relationships92 Questions
Exam 11: Regression Analysis: Statistical Inference82 Questions
Exam 12: Time Series Analysis and Forecasting106 Questions
Exam 13: Introduction to Optimization Modeling97 Questions
Exam 14: Optimization Models114 Questions
Exam 15: Introduction to Simulation Modeling82 Questions
Exam 16: Simulation Models102 Questions
Exam 17: Data Mining20 Questions
Exam 18: Importing Data Into Excel19 Questions
Exam 19: Analysis of Variance and Experimental Design20 Questions
Exam 20: Statistical Process Control20 Questions
Select questions type
Using dummy variables is an efficient way of determining counts of categorical variables.
Free
(True/False)
4.9/5  (31)
(31)
Correct Answer: Verified
True
Below you will find summary measures on starting salaries for classroom teachers across the United States. You will also find a list of selected states and their average starting teacher salary. All values are in thousands of dollars.
Starting salaries for classroom teachers across the United States 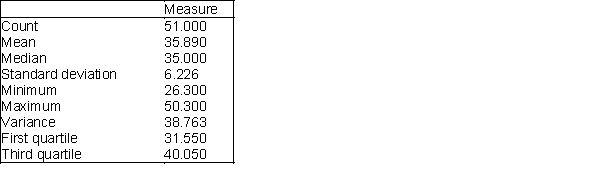 Selected states and their average starting teacher salary (in thousands of dollars)
 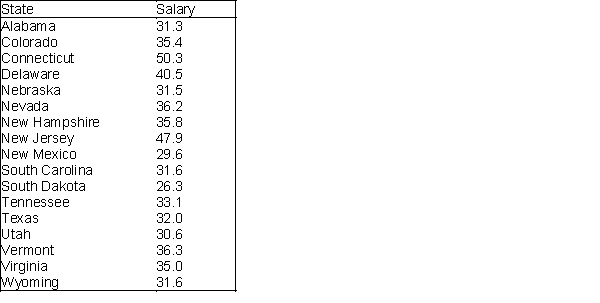 -Which of the states listed paid their teachers average salaries that exceed at least 75% of all average salaries?
Free
(Essay)
4.7/5 (33)
Correct Answer:Verified
Connecticut at 50.3; Delaware at 40.5; and New Jersey at 47.9 (all those > 40.05).
How large must a person's salary should be to qualify as an outlier on the high side? How many outliers are there in these data?
Free
(Essay)
4.9/5 (35)
Correct Answer:Verified
A person's salary should be somewhere above $70,000. There is one male salary that would be considered an outlier (at approximately $80,000)
The difference between the first and third quartile is called the:
(Multiple Choice)
4.8/5 (28)
Suppose that an analysis of a set of test scores reveals that: 
 , and
, and  -What do these statistics tell you about the shape of the distribution?
(Essay)
4.8/5 (35)
The only meaningful way to summarize categorical data is with counts of observations in the categories.
(True/False)
4.8/5 (35)
A distribution of a numerical variable with no skewness is said to be symmetric.
(True/False)
4.7/5 (29)
Time series graphs chart the values of one or more time series, using time on the vertical axis.
(True/False)
4.8/5 (35)
A manager for Marko Manufacturing, Inc. has recently been hearing some complaints that women are being paid less than men for the same type of work in one of their manufacturing plants. The box plots shown below represent the annual salaries for all salaried workers in that facility (40 men and 34 women). 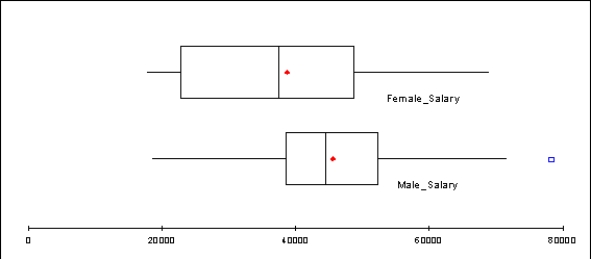 -Would you conclude that there is a difference between the salaries of women and men in this plant? Justify your answer.
(Essay)
4.9/5 (36)
Below you will find summary measures on starting salaries for classroom teachers across the United States. You will also find a list of selected states and their average starting teacher salary. All values are in thousands of dollars.
Starting salaries for classroom teachers across the United States Selected states and their average starting teacher salary (in thousands of dollars)
-Which of the states listed paid their teachers average salaries that are below 75% of all average salaries?
(Essay)
4.9/5 (42)
Coding males as 1 and females as 0 in a data set illustrates the use of:
(Multiple Choice)
4.9/5 (33)
In a generic box plot, the asterisk inside the box indicates the location of the:
(Multiple Choice)
4.9/5 (32)
What can you say about the shape of the distributions given the accompanying box plots?
(Essay)
4.7/5 (42)
Assume that the histogram of a data set is symmetric and bell shaped, with a mean of 75 and standard deviation of 10. Then, approximately 95% of the data values were between 55 and 95.
(True/False)
4.8/5 (28)
In an effort to provide more consistent customer service, the manager of a local fast-food restaurant would like to know the dispersion of customer service times in relation to their average value for the facility's drive-up window. The table below provides summary measures for the customer service times (in minutes) for a sample of 50 customers collected over the past week. 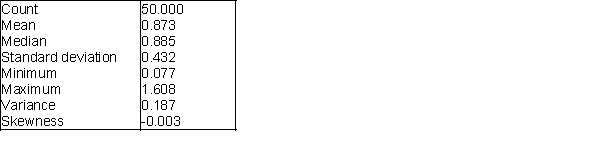 -Interpret the variance and standard deviation of this sample.
(Essay)
4.9/5 (33)
Filters
- Essay(0)
- Multiple Choice(0)
- Short Answer(0)
- True False(0)
- Matching(0)