Exam 8: Confidence Interval Estimation
Exam 1: Introduction to Business Analytics29 Questions
Exam 2: Describing the Distribution of a Single Variable100 Questions
Exam 3: Finding Relationships Among Variables85 Questions
Exam 4: Probability and Probability Distributions114 Questions
Exam 5: Normal, Binomial, Poisson, and Exponential Distributions125 Questions
Exam 6: Decision Making Under Uncertainty107 Questions
Exam 7: Sampling and Sampling Distributions90 Questions
Exam 8: Confidence Interval Estimation84 Questions
Exam 9: Hypothesis Testing87 Questions
Exam 10: Regression Analysis: Estimating Relationships92 Questions
Exam 11: Regression Analysis: Statistical Inference82 Questions
Exam 12: Time Series Analysis and Forecasting106 Questions
Exam 13: Introduction to Optimization Modeling97 Questions
Exam 14: Optimization Models114 Questions
Exam 15: Introduction to Simulation Modeling82 Questions
Exam 16: Simulation Models102 Questions
Exam 17: Data Mining20 Questions
Exam 18: Importing Data Into Excel19 Questions
Exam 19: Analysis of Variance and Experimental Design20 Questions
Exam 20: Statistical Process Control20 Questions
Select questions type
In developing a confidence interval for the difference between two population means using two independent samples, we use the pooled estimate  in estimating the standard error of the sampling distribution of the sample mean difference
  if the populations are normal with equal variances.
Free
(True/False)
4.9/5  (36)
(36)
Correct Answer: Verified
True
The approximate standard error of the point estimate of the population total is  .
.
Free
(True/False)
4.8/5 (31)
Correct Answer:Verified
True
The upper limit of the 90% confidence interval for the population proportion p, given that n = 100; and  = 0.20 is 0.2658.
Free
(True/False)
4.8/5 (28)
Correct Answer:Verified
True
(A) Construct a 95% confidence interval for the difference between the proportions of online and classroom customers who pass the final exam.
(B) Interpret the confidence interval obtained in (A).
(Essay)
4.8/5 (27)
(A) Construct a 95% confidence interval for the mean of the average annual credit account balances.
(B) Interpret the 95% confidence interval constructed in (A).
(C) Use the confidence interval constructed for (A) to help the store evaluate its criteria for whether or not the credit card program is worthwhile.
(Essay)
4.9/5 (30)
The t-distribution and the standard normal distribution are practically indistinguishable as the degrees of freedom increase.
(True/False)
4.7/5 (29)
If the standard error of the sampling distribution of the sample proportion  is 0.0324 for samples of size 200, then the population proportion must be 0.30.
(True/False)
4.9/5 (38)
(A) Construct a 95% confidence interval for the average width of an elevator rail. Do we need to assume that the width of elevator rails follows a normal distribution?
(B) How large a sample of elevator rails would we have to measure to ensure that we could estimate, with 95% confidence, the average diameter of an elevator rail within 0.01 inch?
(Essay)
4.8/5 (36)
Samples of exam scores for employees before and after a training class are examples of paired data.
(True/False)
4.9/5 (40)
In constructing a confidence interval estimate for the difference between the means of two populations, where the unknown population variances are assumed not to be equal, summary statistics computed from two independent samples are as follows:  ,
,  ,
,  ,
,  ,
,  , and
, and  . Construct a 90% confidence interval for
  .
.
(Essay)
4.9/5 (28)
The following values have been calculated using the T DIST and T INV functions in Excel®. These values come from a t- distribution with 15 degrees of freedom.
These values represent the probability to the right of the given positive values. 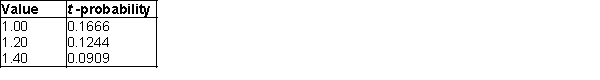 These values represent the positive t- value for a given probability in both tails (sum of both tails).
 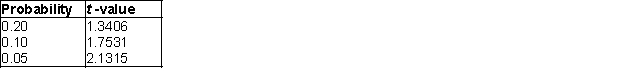 -What would be the t-value where 0.05 of the values are in the upper tail?
(Short Answer)
4.7/5 (35)
The following values have been calculated using the T DIST and T INV functions in Excel®. These values come from a t- distribution with 15 degrees of freedom.
These values represent the probability to the right of the given positive values. These values represent the positive t- value for a given probability in both tails (sum of both tails).
-What would be the t-values where 0.10 of the values are in both tails (sum of both tails)?
(Short Answer)
4.8/5 (33)
(A) Construct a 95% confidence interval for the mean playing time of all Willie Nelson recordings.
(B) Interpret the confidence interval you constructed in (A).
(Essay)
4.9/5 (34)
When samples of size n are drawn from a population, then the sampling distribution of the sample mean  is approximately normal, provided that n is reasonably large.
(True/False)
4.8/5 (36)
The average annual household income levels of citizens of selected U.S. cities are shown below. 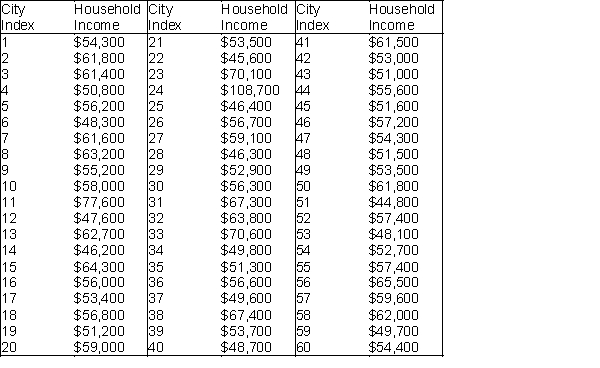 -(A) Use Excel® to obtain a simple random sample of size 10 from this frame.
(B) Using the sample generated in (A), construct a 95% confidence interval for the mean average annual household income level of citizens in the selected U.S. cities. Assume that the population consists of all average annual household income levels in the given frame.
(C) Interpret the 95% confidence interval constructed in (B).
(D) Does the 95% confidence interval contain the actual population mean? If not, explain why not. What proportion of many similarly constructed confidence intervals should include the true population mean value?
-(A) Use Excel® to obtain a simple random sample of size 10 from this frame.
(B) Using the sample generated in (A), construct a 95% confidence interval for the mean average annual household income level of citizens in the selected U.S. cities. Assume that the population consists of all average annual household income levels in the given frame.
(C) Interpret the 95% confidence interval constructed in (B).
(D) Does the 95% confidence interval contain the actual population mean? If not, explain why not. What proportion of many similarly constructed confidence intervals should include the true population mean value?
(Essay)
5.0/5 (34)
You are attempting to estimate the average amount a family spends on food during a year. In the past, the standard deviation of the amount a family has spent on food during a year has been approximately $1200. If you want to be 99% sure that you have estimated average family food expenditures within $60, how many families do you need to survey?
(Essay)
4.9/5 (34)
As the sample size increases, the t-distribution becomes more similar to the ____ distribution.
(Multiple Choice)
4.8/5 (33)
(A) Find a 95% confidence interval for the mean account balance on this store's credit card (the t-multiple with 39 degrees of freedom is 2.0227).
(B) What sample size would be needed to ensure that we could estimate the true mean account balance and have only 5 chances in 100 of being off by more than $100?
(Essay)
4.8/5 (22)
Filters
- Essay(0)
- Multiple Choice(0)
- Short Answer(0)
- True False(0)
- Matching(0)