Exam 15: Introduction to Simulation Modeling
In general, important characteristics of probability distributions include the following distinctions:
E
(A) Use a simulation model to help the institute decide how many violins they must reserve with the instrument company. Consider five different possible reservation quantities: 400, 500, 600, 700, 800. Which of these quantities yields the highest total revenue, net of instrument costs?
(B) Which simulation yields the largest median total revenue?
(C) Which simulation has the most risk as measured by spread or dispersion in the data? Please state clearly what statistic you used to answer this question.
(D) Are there any simulations in which there is at least a 1 in 20 (i.e., 5%) chance of getting a negative total revenue? Briefly explain in one sentence.
(E) For each simulation, what is the probability of exceeding $175,000 in total revenue (approximate these numbers as closely as possible from the data given in the above table). Please put your answer in the following table:  (F) Considering your answers for (A) through (E), please state how many instruments you think should be reserved in advance and explain why.
(G) Suppose the institute is able to negotiate with the instrument company to reduce the cost for a violin from $500 to $350. Re-run the simulation model using the same reservation quantities (but with $350 for the unused instrument cost). Has the reservation quantity that yields the highest average revenue changed? If so, please explain why this has occurred.
(F) Considering your answers for (A) through (E), please state how many instruments you think should be reserved in advance and explain why.
(G) Suppose the institute is able to negotiate with the instrument company to reduce the cost for a violin from $500 to $350. Re-run the simulation model using the same reservation quantities (but with $350 for the unused instrument cost). Has the reservation quantity that yields the highest average revenue changed? If so, please explain why this has occurred.
(A) Simulation 3 (Q=600 instruments) yields the largest mean value of $201,295.50 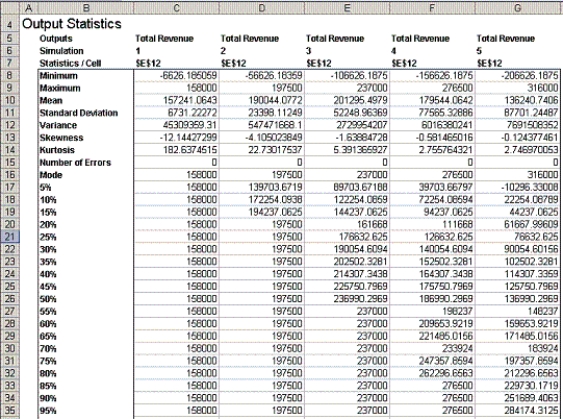 (B) Simulation 3 (Q=600 instruments) has a median (50th percentile) of $236,990.30 which is the largest value.
(C) The standard deviation of Simulation 5 (Q=800 instruments) is the largest, so it has the most "spread or dispersion".
(D) Yes. The 5% for Simulation 5 (Q=800 instruments) is negative, so there is at least a 5% chance of getting a negative number with this alternative.
(E)  (F) The institute should reserve 600 instruments because the expected total revenue is maximized and there is about a 70% chance that they will obtain a higher value than the corresponding value for the next best solution of instruments.
(G) Profits are somewhat higher, because the penalty for having the unused instruments is now lower, but it is still best to reserve 600 instruments. 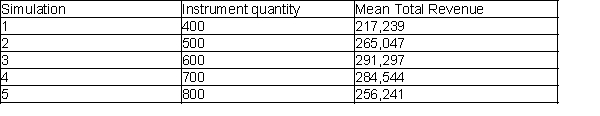
A continuous probability distribution is characterized by a(n):
C
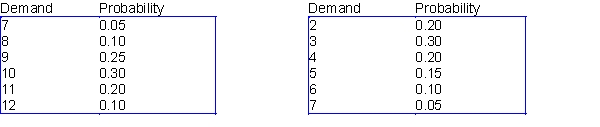
Oregon State University has reached the final four in the 2016 NCAA Women's Basketball Tournament, and as a result, a sweatshirt supplier in Corvallis is trying to decide how many sweatshirts to print for the upcoming championships. The final four teams (Oregon State, University of Washington, Syracuse, and University of Connecticut) have emerged from the quarterfinal round, and there is a week left until the semifinals, which are then followed in a couple of days by the finals. Each sweatshirt costs $12 to produce and sells for $24. However, in three weeks, any leftover sweatshirts will be put on sale for half price, $12. The supplier assumes that the demand (in thousands) for his sweatshirts during the next three weeks, when interest is at its highest, follows the probability distribution shown in the table below. The residual demand, after the sweatshirts have been put on sale, also has the probability distribution shown in the table below. The supplier realizes that every sweatshirt sold, even at the sale price, yields a profit. However, he also realizes that any sweatshirts produced but not sold must be thrown away, resulting in a $12 loss per sweatshirt.
Demand distribution at regular price Demand distribution at reduced price
 -Use @RISK simulation add-in to analyze the sweatshirt sales. Do this for the discrete distributions given in the problem.
A probability distribution is continuous if its possible values fall alongy some continuum.
The three parameters required to specify a triangular distribution are the minimum, mean, and maximum.
If we want to model the time it takes to serve a customer at a bank, we will probably choose a(n):
The RAND() function in Excel® models which of the following probability distributions?
A correlation matrix must always be symmetric, so that the correlations above the diagonal are a mirror image of those below it.
Assume that x is a random number between 0 and 1, and that the number of units expected to be sold is uniformly distributed between 300 and 500. In this case, sales are given by the expression:
A company is about to develop and then market a new product. It wants to build a simulation model for the entire process, and one key uncertain input is the development time, which is measured in an integer number of months. For each of the scenarios in the questions below, choose an "appropriate" distribution, together with its parameters, and explain your choice.
-Company experts believe the development time will be from 5 to 9 months. They believe that 7 months is twice as likely as either 6 months or 8 months and that either of these latter possibilities is three times as likely as either 5 months or 9 months.
The deterministic (non-simulation) approach, using best guesses for the uncertain inputs, is:
A probability distribution is bounded if there are values A and B such that only one possible value can be less than A or greater than B.
An oil company is trying to determine the amount of oil that it can expect to recover from an oil field. The unknowns are: the area of the field (in acres), the thickness of the oil-sand layer, and the primary recovery factor (in barrels per acre per foot of thickness). Based on geological information, the following probability distributions have been estimated 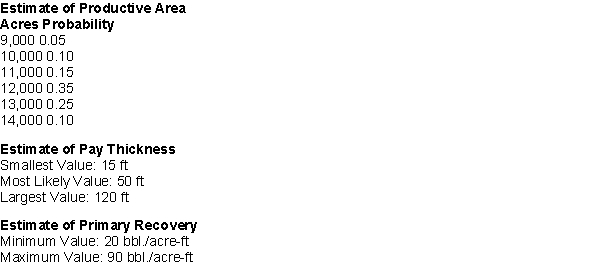 The amount of reserves that can be produced is then the product of the area, thickness, and recovery factor:
Number of barrels = Productive Area x Pay Thickness x Primary Recovery Factor
-(A) Use @RISK distributions to generate the three random variables and derive a distribution for the amount of reserves. What is the amount we can expect to recover from this field?
(B) The production output is a product of three very different types of input distributions. What does the output distribution look like? What are the implications of the shape of this distribution?
(C) What is the standard deviation of the recoverable reserves? What are the 5th and 95th percentiles of this distribution? What does this imply about the uncertainty in estimating the amount of recoverable reserves?
(D) Suppose you think oil price is normally distributed with a mean of $65 per barrel and a standard deviation of $10. How much revenue do you expect the field to produce (ignore discounting)?
(E) Finally, your engineer is uncertain about costs to drill wells to develop the field, but she thinks the most likely cost will be $1.7Bn, although it could be as much as $3Bn or as little as $1Bn. What is your expected profit from the field?
(F) What is the chance that you will loose money? Is this a risky venture?
The amount of reserves that can be produced is then the product of the area, thickness, and recovery factor:
Number of barrels = Productive Area x Pay Thickness x Primary Recovery Factor
-(A) Use @RISK distributions to generate the three random variables and derive a distribution for the amount of reserves. What is the amount we can expect to recover from this field?
(B) The production output is a product of three very different types of input distributions. What does the output distribution look like? What are the implications of the shape of this distribution?
(C) What is the standard deviation of the recoverable reserves? What are the 5th and 95th percentiles of this distribution? What does this imply about the uncertainty in estimating the amount of recoverable reserves?
(D) Suppose you think oil price is normally distributed with a mean of $65 per barrel and a standard deviation of $10. How much revenue do you expect the field to produce (ignore discounting)?
(E) Finally, your engineer is uncertain about costs to drill wells to develop the field, but she thinks the most likely cost will be $1.7Bn, although it could be as much as $3Bn or as little as $1Bn. What is your expected profit from the field?
(F) What is the chance that you will loose money? Is this a risky venture?
A random number from a binomial distribution indicates the number of successes in a certain number of identical trials.
A correlation matrix must always have 1's along its diagonal (because a variable is always perfectly correlated with itself) and the correlations between variables elsewhere.
Suppose you run a simulation model several times with different order quantities. What can we infer about the the quantity that maximizes the output, the company's profit?
If a model contains uncertain outputs, it can be very misleading to build a deterministic model by using the means of the inputs to predict an output. This is called the:
Filters
- Essay(0)
- Multiple Choice(0)
- Short Answer(0)
- True False(0)
- Matching(0)