Exam 7: Sampling and Sampling Distributions
Exam 1: Introduction to Business Analytics29 Questions
Exam 2: Describing the Distribution of a Single Variable100 Questions
Exam 3: Finding Relationships Among Variables85 Questions
Exam 4: Probability and Probability Distributions114 Questions
Exam 5: Normal, Binomial, Poisson, and Exponential Distributions125 Questions
Exam 6: Decision Making Under Uncertainty107 Questions
Exam 7: Sampling and Sampling Distributions90 Questions
Exam 8: Confidence Interval Estimation84 Questions
Exam 9: Hypothesis Testing87 Questions
Exam 10: Regression Analysis: Estimating Relationships92 Questions
Exam 11: Regression Analysis: Statistical Inference82 Questions
Exam 12: Time Series Analysis and Forecasting106 Questions
Exam 13: Introduction to Optimization Modeling97 Questions
Exam 14: Optimization Models114 Questions
Exam 15: Introduction to Simulation Modeling82 Questions
Exam 16: Simulation Models102 Questions
Exam 17: Data Mining20 Questions
Exam 18: Importing Data Into Excel19 Questions
Exam 19: Analysis of Variance and Experimental Design20 Questions
Exam 20: Statistical Process Control20 Questions
Select questions type
An unbiased estimator is a sample statistic:
Free
(Multiple Choice)
4.8/5  (34)
(34)
Correct Answer: Verified
B
(A) Find the mean and standard deviation of the sampling distribution of the average weekly earnings in the sample.
(B) Find probability that the mean of the sample is less than $445.
(C) Find the probability that the mean of the sample is between $445 and $455.
(D) Find the probability that the mean of the sample is greater than $460.
(E) Explain why the assumption of normality about the distribution of the average weekly earnings for employees was not involved in the answers to (A) through (D).
Free
(Essay)
4.8/5 (37)
Correct Answer:Verified
(A) E(  ) =
) =  = 450, and SE(
  ) =
) =  = 5
= 5
(B) P(  < 445) = P(Z < -1) = 0.5000 - 0.3413 = 0.1587
(C) P(445<  <455) = P(-1.0 < Z < 1.0) = 2(0.3413) = 0.6826
(D) P(  > 460) = P(Z > 2.0) = 0.5000 - 0.4772 = 0.0228
(E) The sample size is large; n = 100 is greater than 30, so the distribution of the average weekly earnings for employees is at least approximately normal.
The sampling distribution of any point estimate (such as the sample mean or proportion) is the distribution of the point estimates we would obtain from all possible samples of a given size drawn from the population.
Free
(True/False)
4.9/5 (36)
Correct Answer:Verified
True
In stratified sampling, the population is divided into relatively homogeneous subsets called strata, and then random samples are taken from each stratum.
(True/False)
4.7/5 (37)
When we sample less than 5% of the population, the finite population correction factor; fpc =  , is used to modify the formula for the standard error of the sample mean.
(True/False)
4.7/5 (38)
In systematic sampling, one of the first k members is selected randomly, and then every kth member after this one is selected. The value k is called the sampling interval and equals the ratio N / n, where N is the population size and n is the desired sample size.
(True/False)
4.8/5 (41)
The standard error of the estimate measures how much estimates vary from sample to sample.
(True/False)
4.7/5 (34)
Auditors of Old Kent Bank are interested in comparing the reported value of customer savings account balances with their own findings regarding the actual value of such assets. Rather than reviewing the records of each savings account at the bank, the auditors decide to examine a representative sample of savings account balances. The frame from which they will sample is shown below. 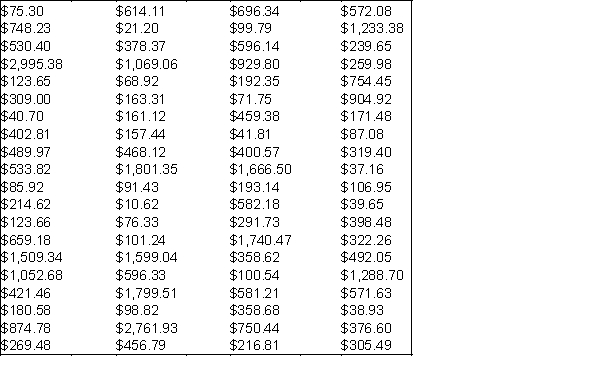 -(A) What sample size would be required for the auditors to be approximately 95% sure that their estimate of the average savings account balance at this bank is within $150 of the true mean? Assume that their best estimate of the population standard deviation
  is $300.
(B) Choose a simple random sample of the size found in (A).
(C) Compute the observed sampling error based on the sample you have drawn from the population. How does the actual sampling error compare to the maximum possible probable absolute error established in (A)? Explain
is $300.
(B) Choose a simple random sample of the size found in (A).
(C) Compute the observed sampling error based on the sample you have drawn from the population. How does the actual sampling error compare to the maximum possible probable absolute error established in (A)? Explain
(Essay)
5.0/5 (36)
A probability sample is a sample in which the sampling units are chosen from the population by means of a random mechanism such as a random number table.
(True/False)
4.7/5 (30)
The sampling distribution of the mean will have the same mean as the original population from which the samples were drawn.
(True/False)
4.8/5 (31)
Which of the following is not a consideration when determining appropriate sample size?
(Multiple Choice)
4.8/5 (31)
The sampling distribution of the mean will have the same standard deviation as the original population from which the samples were drawn.
(True/False)
4.7/5 (30)
The averaging effect means that as you average more and more observations from a given distribution, the variance of the average:
(Multiple Choice)
4.8/5 (26)
The manager of a local fast-food restaurant is interested in improving service provided to customers who use the restaurant's drive-up window. As a first step in the process, the manager asks his assistant to record the time (in minutes) it takes to serve a large number of customers at the final window in the facility's drive-up system. The given frame in this case is 200 customer service times observed during the busiest hour of the day for this fast-food restaurant. The frame of 200 service times yielded a mean of 0.881. A simple random sample of 10 from this frame is presented below.  -(A) Compute the point estimate of the population mean from the sample above. What is the sampling error in this case? Assume that the population consists of the given 200 customer service times.
(B) Compute the point estimate of the population standard deviation from the sample above.
(C) Should you use the finite population correction (fpc) factor to estimate the standard error of
-(A) Compute the point estimate of the population mean from the sample above. What is the sampling error in this case? Assume that the population consists of the given 200 customer service times.
(B) Compute the point estimate of the population standard deviation from the sample above.
(C) Should you use the finite population correction (fpc) factor to estimate the standard error of  ? Explain. If your answer is yes, what is the value of the fpc?
(D) Determine a good approximation to the standard error of the mean in this case.
? Explain. If your answer is yes, what is the value of the fpc?
(D) Determine a good approximation to the standard error of the mean in this case.
(Essay)
4.8/5 (31)
A list of all members of the population from which we can choose a sample is called a frame, and the potential sample members are called sampling units.
(True/False)
4.8/5 (34)
Simple random samples are samples in which each member of the population has the same chance of being chosen.
(True/False)
4.9/5 (40)
Filters
- Essay(0)
- Multiple Choice(0)
- Short Answer(0)
- True False(0)
- Matching(0)