Exam 3: Finding Relationships Among Variables
Exam 1: Introduction to Business Analytics29 Questions
Exam 2: Describing the Distribution of a Single Variable100 Questions
Exam 3: Finding Relationships Among Variables85 Questions
Exam 4: Probability and Probability Distributions114 Questions
Exam 5: Normal, Binomial, Poisson, and Exponential Distributions125 Questions
Exam 6: Decision Making Under Uncertainty107 Questions
Exam 7: Sampling and Sampling Distributions90 Questions
Exam 8: Confidence Interval Estimation84 Questions
Exam 9: Hypothesis Testing87 Questions
Exam 10: Regression Analysis: Estimating Relationships92 Questions
Exam 11: Regression Analysis: Statistical Inference82 Questions
Exam 12: Time Series Analysis and Forecasting106 Questions
Exam 13: Introduction to Optimization Modeling97 Questions
Exam 14: Optimization Models114 Questions
Exam 15: Introduction to Simulation Modeling82 Questions
Exam 16: Simulation Models102 Questions
Exam 17: Data Mining20 Questions
Exam 18: Importing Data Into Excel19 Questions
Exam 19: Analysis of Variance and Experimental Design20 Questions
Exam 20: Statistical Process Control20 Questions
Select questions type
Of those in the sample who did well in the final exam, what percentage of them spent the weekend before the exam studying?
Free
(Short Answer)
4.9/5  (33)
(33)
Correct Answer: Verified
60 out of 82, or 73.17%
We must specify appropriate bins for side-by-side histograms in order to make fair comparisons of distributions by category.
Free
(True/False)
4.9/5 (33)
Correct Answer:Verified
True
Displaying all correlations between 0.6 and 0.999 on a scatterplot as green and all correlations between -1.0 and -0.6 as red is known as:
Free
(Multiple Choice)
4.9/5 (34)
Correct Answer:Verified
C
Suppose a car dealer collects the following information about a sample of 448 residents in the city of ABC:
· Exact salaries of these ABC residents
· Education level (completed high school only or completed college)
· Income level (low or high)
· Car finance (whether or not the last purchased car was financed)
Using the education level, income level, and car finance data, the car dealer creates the three pivot tables shown below. Based on these tables, determine how education and income influence the likelihood that a family finances a car. 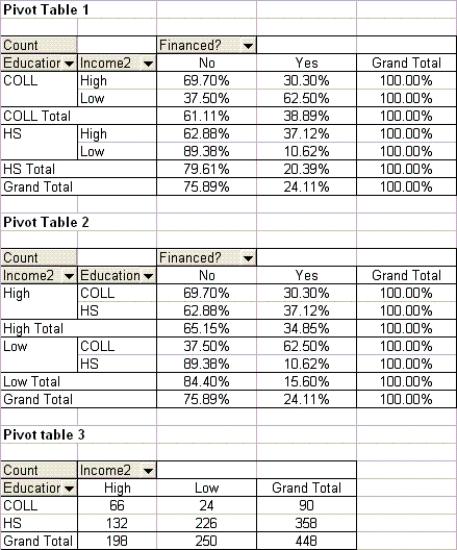
(Essay)
4.9/5 (30)
A recent survey collected data from 1000 randomly selected Internet users. The characteristics of the users include their gender, age, education, marital status, and annual income. Using Excel®, the following pivot tables are produced.
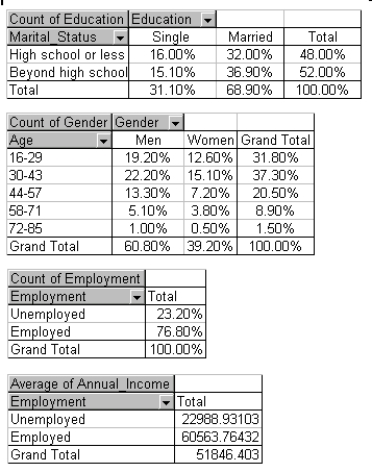 -Approximate the percentage of these Internet users who are single with no formal education beyond high school.
(Short Answer)
4.8/5 (32)
Do these data help to confirm or contradict the hypothesis that increased wage inequality is associated with lower unemployment levels? [Hint: construct a scatterplot.]
(Essay)
4.9/5 (36)
An economic development researcher wants to understand the relationship between the average monthly expenditure on utilities for households in a particular middle-class neighborhood and each of the following household variables: family size, approximate location of the household within the neighborhood, and indication of whether those surveyed owned or rented their home, gross annual income of the first household wage earner, gross annual income of the second household wage earner (if applicable), size of the monthly home mortgage or rent payment, and the total indebtedness (excluding the value of a home mortgage) of the household.
The correlation for each pairing of variables are shown in the table below:
Table of correlations 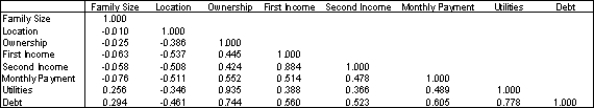 -Which of the variables have a negative linear relationship with the household's average monthly expenditure on utilities?
(Essay)
4.8/5 (44)
Of those in the sample who went partying the weekend before the final exam, what percentage of them did poorly in the exam?
(Short Answer)
4.9/5 (34)
What other data would you need to be more confident that increased income inequality leads to lower unemployment?
(Essay)
4.9/5 (34)
A sample of 150 students at a state university was taken after the final business statistics exam to ask them whether they went partying the weekend before the final or spent the weekend studying, and whether they did well or poorly on the final. The following table contains the result. 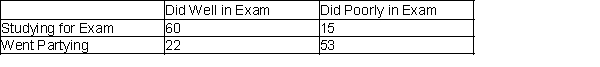 -Of those in the sample who did well on the final exam, what percentage of them went partying the weekend before the exam?
(Short Answer)
4.9/5 (28)
The advantage that correlation has over covariance is that the former has a set lower and upper limit.
(True/False)
4.8/5 (33)
To form a scatterplot of X versus Y, X and Y must be paired variables.
(True/False)
4.8/5 (35)
Which Excel® function allows you to count using more than one criterion?
(Multiple Choice)
4.8/5 (28)
A recent survey collected data from 1000 randomly selected Internet users. The characteristics of the users include their gender, age, education, marital status, and annual income. Using Excel®, the following pivot tables are produced.
-Approximate the percentage of these Internet users who are currently employed.
(Short Answer)
4.9/5 (26)
Below you will find current annual salary data and related information for 30 employees at Gamma Technologies, Inc. These data include each selected employees gender (1 for female; 0 for male), age, number of years of relevant work experience prior to employment at Gamma, number of years of employment at Gamma, the number of years of post-secondary education, and annual salary. The tables of correlations and covariances are presented below.
Table of Correlations 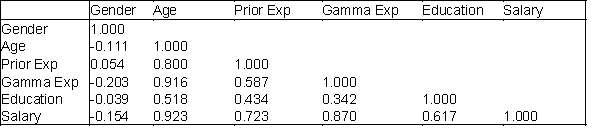 Table of Covariances (variances on the diagonal)
 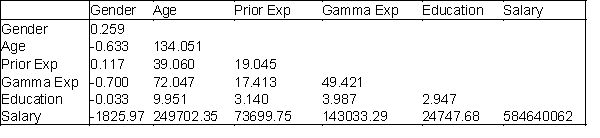 -Which two variables have the strongest linear relationship with annual salary?
(Essay)
4.8/5 (31)
The correlation between two variables is unitless and always between -1 and +1.
(True/False)
4.9/5 (28)
If the sample is a good representation of the population, what percentage of those who did poorly on the final exam should we expect to have spent the weekend studying?
(Short Answer)
4.9/5 (33)
Filters
- Essay(0)
- Multiple Choice(0)
- Short Answer(0)
- True False(0)
- Matching(0)