Exam 7: Sampling and Sampling Distributions
Exam 1: Introduction to Business Analytics29 Questions
Exam 2: Describing the Distribution of a Single Variable100 Questions
Exam 3: Finding Relationships Among Variables85 Questions
Exam 4: Probability and Probability Distributions114 Questions
Exam 5: Normal, Binomial, Poisson, and Exponential Distributions125 Questions
Exam 6: Decision Making Under Uncertainty107 Questions
Exam 7: Sampling and Sampling Distributions90 Questions
Exam 8: Confidence Interval Estimation84 Questions
Exam 9: Hypothesis Testing87 Questions
Exam 10: Regression Analysis: Estimating Relationships92 Questions
Exam 11: Regression Analysis: Statistical Inference82 Questions
Exam 12: Time Series Analysis and Forecasting106 Questions
Exam 13: Introduction to Optimization Modeling97 Questions
Exam 14: Optimization Models114 Questions
Exam 15: Introduction to Simulation Modeling82 Questions
Exam 16: Simulation Models102 Questions
Exam 17: Data Mining20 Questions
Exam 18: Importing Data Into Excel19 Questions
Exam 19: Analysis of Variance and Experimental Design20 Questions
Exam 20: Statistical Process Control20 Questions
Select questions type
The finite population correction factor,  , should generally be used when:
(Multiple Choice)
4.9/5  (34)
(34)
We can measure the accuracy of judgmental samples by applying some simple rules of probability. This way, judgmental samples are not likely to contain our built-in biases.
(True/False)
4.7/5 (46)
The manager of a local fast-food restaurant is interested in improving service provided to customers who use the restaurant's drive-up window. As a first step in the process, the manager asks his assistant to record the time (in minutes) it takes to serve a large number of customers at the final window in the facility's drive-up system. The given frame in this case is 200 customer service times observed during the busiest hour of the day for this fast-food restaurant. The frame of 200 service times yielded a mean of 0.881. A simple random sample of 10 from this frame is presented below.  -(A) What sample size would be required for the production personnel to be approximately 95% sure that their estimate of the average number of defective batteries per box is within 0.3 unit of the true mean? Assume that the best estimate of the population standard deviation (
  ) is 0.9 defective batteries per box.
(B) How does your answer to (A) change if the production personnel want their estimate to be within 0.5 unit of the actual population mean? Evaluate the tradeoff between required accuracy and sample size requirement for this case and the case in (A).
) is 0.9 defective batteries per box.
(B) How does your answer to (A) change if the production personnel want their estimate to be within 0.5 unit of the actual population mean? Evaluate the tradeoff between required accuracy and sample size requirement for this case and the case in (A).
(Essay)
4.8/5 (37)
If the sample size is greater than 30, the Central Limit Theorem (CLT) will always apply.
(True/False)
4.9/5 (34)
The two basic sources for error when using random sampling are:
(Multiple Choice)
4.7/5 (37)
One obvious advantage of stratified sampling is that we obtain separate estimates within each stratum - which we would not obtain if we took a simple random sample from the entire population. A more important advantage is that we can increase the accuracy of the resulting population estimates by using appropriately defined strata.
(True/False)
4.8/5 (30)
When the sample size is greater than 5% of the population, the formula for the standard error of the mean should be modified with a finite population correction.
(True/False)
4.8/5 (29)
Which of the following are reasons for why simple random sampling is used infrequently in real applications?
(Multiple Choice)
4.9/5 (36)
Estimation is the process of inferring the value of an unknown population parameter using data from a random sample
(True/False)
4.9/5 (47)
A columnist for the LA Times is working to meet a deadline on a story about commuting in Los Angeles. She wants to include information about the current price of gasoline in the Los Angeles metro area, but her source person for this type of information has already gone home for the day. So she decides to take her own sample as she drives home, writing down the prices she observes as she makes her way from downtown to her neighborhood in the suburbs. Below is the data sample she obtains (units are $/gallon). 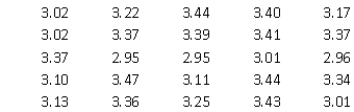 -(A) Do you think she has obtained a true random sample?
(B) What average price could she report, based on the above sample?
(C) What average price range could she report, based on the above sample?
(D) Do you see any issues with reporting the range calculated for (C)?
-(A) Do you think she has obtained a true random sample?
(B) What average price could she report, based on the above sample?
(C) What average price range could she report, based on the above sample?
(D) Do you see any issues with reporting the range calculated for (C)?
(Essay)
4.7/5 (33)
A sales manager for a company that makes commercial ovens for restaurants is interested in estimating the average number of restaurants in all metropolitan areas across the entire country. He does not have access to the data for each metropolitan location, so he had decided to select a sample that will be representative of all such areas, and will use a sample size of 30. Do you believe that simple random sampling is the best approach to obtaining a representative subset of the metropolitan areas in the given frame? Explain. If not, recommend how the sales manager might proceed to select a better sample of size 30 from this data?
(Essay)
4.9/5 (32)
Simple random sampling can result in under-representation or over-representation of certain segments of the population. This is one of several reasons that simple random samples are almost never used in real applications.
(True/False)
5.0/5 (28)
Which of the following statements correctly describe estimation?
(Multiple Choice)
4.8/5 (39)
A sample chosen in such a way that every possible subset of same size has an equal chance of being selected is called a(n):
(Multiple Choice)
4.8/5 (39)
A sample of size 20 is selected at random from a population of size N. If the finite population correction factor is 0.9418, then N must be 169.
(True/False)
4.9/5 (33)
Filters
- Essay(0)
- Multiple Choice(0)
- Short Answer(0)
- True False(0)
- Matching(0)