Exam 7: Sampling and Sampling Distributions
Exam 1: Introduction to Business Analytics29 Questions
Exam 2: Describing the Distribution of a Single Variable100 Questions
Exam 3: Finding Relationships Among Variables85 Questions
Exam 4: Probability and Probability Distributions114 Questions
Exam 5: Normal, Binomial, Poisson, and Exponential Distributions125 Questions
Exam 6: Decision Making Under Uncertainty107 Questions
Exam 7: Sampling and Sampling Distributions90 Questions
Exam 8: Confidence Interval Estimation84 Questions
Exam 9: Hypothesis Testing87 Questions
Exam 10: Regression Analysis: Estimating Relationships92 Questions
Exam 11: Regression Analysis: Statistical Inference82 Questions
Exam 12: Time Series Analysis and Forecasting106 Questions
Exam 13: Introduction to Optimization Modeling97 Questions
Exam 14: Optimization Models114 Questions
Exam 15: Introduction to Simulation Modeling82 Questions
Exam 16: Simulation Models102 Questions
Exam 17: Data Mining20 Questions
Exam 18: Importing Data Into Excel19 Questions
Exam 19: Analysis of Variance and Experimental Design20 Questions
Exam 20: Statistical Process Control20 Questions
Select questions type
The difference between the point estimate and the true value of the population parameter being estimated is called the estimation error.
(True/False)
4.9/5  (40)
(40)
The primary advantage of cluster sampling is sampling convenience (and possibly less cost). The downside, however, is that the inferences drawn from a cluster sample can be less accurate, for a given sample size, than for other sampling plans.
(True/False)
4.8/5 (35)
The probability of being chosen in a simple random sample of size n from a population of size N is:
(Multiple Choice)
4.9/5 (33)
Systematic sampling is generally similar to simple random sampling in its statistical properties.
(True/False)
4.8/5 (34)
The approximate 95% confidence interval for a population mean is:
(Multiple Choice)
4.9/5 (36)
The standard error of an estimate is the standard deviation of the sampling distribution of the estimate. It measures how much estimates from different samples vary.
(True/False)
4.7/5 (32)
It is customary to approximate the standard error of the sample mean  by substituting the sample standard deviation s for
  in the formula: SE(
  ) =
) =  .
.
(True/False)
4.8/5 (27)
An unbiased estimate is a point estimate such that the mean of its sampling distribution is equal to the true value of the population parameter being estimated.
(True/False)
4.8/5 (42)
The standard error of sample mean  is large when the observations in the population are spread out (large
  ), but that the standard error can be reduced by taking a smaller sample.
(True/False)
4.9/5 (32)
A statistics professor has just given the final examination in his introductory statistics course. In particular, he is interested in learning how his class of 50 students performed on this exam. The data are shown below. 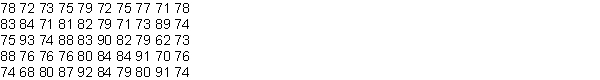 -(A) Technically, this process does not yield a random sample of the books in the store. Why not?
(B) How could a truly random sample be obtained?
-(A) Technically, this process does not yield a random sample of the books in the store. Why not?
(B) How could a truly random sample be obtained?
(Essay)
4.9/5 (37)
The sampling mean  is the ____ estimate for the population mean
  .
.
(Multiple Choice)
4.8/5 (31)
The theorem that states that the sampling distribution of the sample mean  is approximately normal when the sample size n is reasonably large is known as the:
(Multiple Choice)
4.9/5 (40)
The finite population correction factor is a correction for the standard error when the sample size is fairly large relative to the population size.
(True/False)
4.9/5 (38)
A statistics professor has just given the final examination in his introductory statistics course. In particular, he is interested in learning how his class of 50 students performed on this exam. The data are shown below.
-(A) Using these 50 students as the frame, use Excel to generate a simple random sample of size 10 from this frame.
(B) Compute the mean scores in the frame and the simple random sample you generated in (A).
(C) Compare the mean scores you computed in (B). Is your simple random sample a good representative of the frame? Why or why not?
(D) Using these 50 students as the frame, use Excel to generate a systematic sample of size 10 from this frame.
(E) Compare the mean scores in the frame with that in the systematic sample in (D). What do you conclude?
(Essay)
4.8/5 (35)
Sally Bird of Big Rapids Realty has received data on 60 houses that were recently sold in Mecosta County in Michigan. The data are recorded in the table shown below. Included in this data set are observations for each of the following variables:
· The appraised value of each house (in thousands of dollars)
· The selling price of each house (in thousands of dollars)
· The size of each house (in hundreds of square feet)
· The number of bedrooms in each house 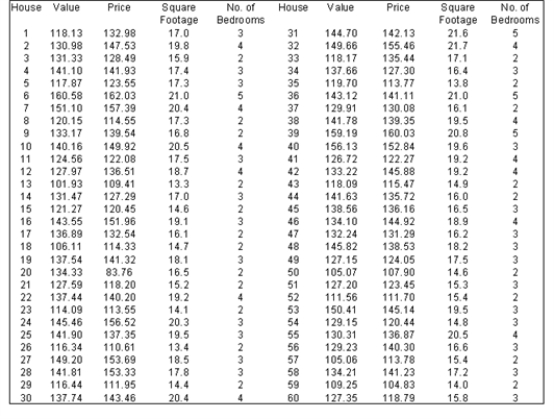 -(A) Suppose that Sally wishes to examine a representative subset of these 60 houses that has been stratified by the number of bedrooms. Use Excel to assist her by finding such a stratified sample of size 10 with proportional sample sizes.
(B) Explain how Sally could apply cluster sampling in selecting a sample of size 15 from this frame.
(C) What are the advantages and disadvantages of employing cluster sampling in this case?
-(A) Suppose that Sally wishes to examine a representative subset of these 60 houses that has been stratified by the number of bedrooms. Use Excel to assist her by finding such a stratified sample of size 10 with proportional sample sizes.
(B) Explain how Sally could apply cluster sampling in selecting a sample of size 15 from this frame.
(C) What are the advantages and disadvantages of employing cluster sampling in this case?
(Essay)
4.9/5 (39)
Filters
- Essay(0)
- Multiple Choice(0)
- Short Answer(0)
- True False(0)
- Matching(0)