Exam 18: Nonparametric Methods
Exam 1: Data and Statistics98 Questions
Exam 2: Descriptive Statistics: Tabular and Graphical Displays62 Questions
Exam 3: Descriptive Statistics: Numerical Measures173 Questions
Exam 4: Introduction to Probability138 Questions
Exam 5: Discrete Probability Distributions123 Questions
Exam 6: Continuous Probability Distributions174 Questions
Exam 7: Sampling and Sampling Distributions133 Questions
Exam 8: Interval Estimation137 Questions
Exam 9: Hypothesis Tests148 Questions
Exam 10: Inference About Means and Proportions With Two Populations121 Questions
Exam 11: Inferences About Population Variances90 Questions
Exam 12: Comparing Multiple Proportions, Test of Independence and Goodness of Fit90 Questions
Exam 13: Experimental Design and Analysis of Variance115 Questions
Exam 14: Simple Linear Regression146 Questions
Exam 15: Multiple Regression115 Questions
Exam 16: Regression Analysis: Model Building76 Questions
Exam 17: Time Series Analysis and Forecasting68 Questions
Exam 18: Nonparametric Methods81 Questions
Exam 19: Statistical Methods for Quality Control29 Questions
Exam 20: Index Numbers52 Questions
Exam 21: Decision Analysis on Website65 Questions
Exam 22: Sample Survey on Website63 Questions
Select questions type
Three universities in your state have decided to administer the same comprehensive examination to the recipients of MBA degrees. From each institution, a random sample of MBA recipients has been selected and given the test. The following table shows the scores of the students from each university. 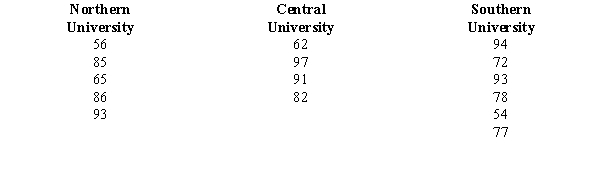 Use the Kruskal-Wallis test to determine if there is a significant difference in the average scores of the students from the three universities. Let = 0.01.
Free
(Essay)
4.9/5  (41)
(41)
Correct Answer: Verified
W = 0.2; p-value > 0.1; do not reject H0; no significant difference (critical 2 = 9.210)
Two faculty members ranked 12 candidates for scholarships. Calculate the Spearman rank-correlation coefficient and test it for significance. Use a .02 level of significance. 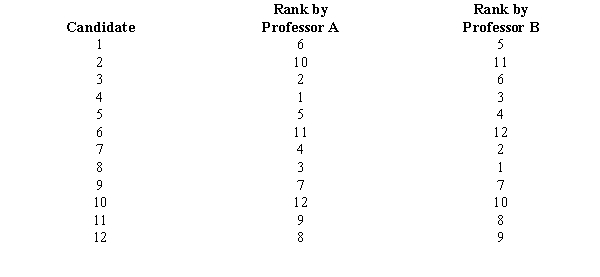
Free
(Essay)
4.8/5 (37)
Correct Answer:Verified
rs = 0.8671
Z = 2.88; p-value = 0.004; reject the null hypothesis; the rank correlation is significant
Two faculty members (X and Y) ranked five candidates for scholarships. The rankings are shown below. 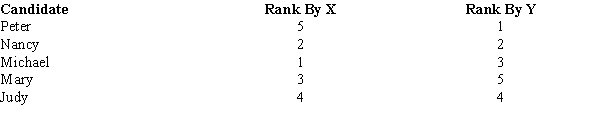 Compute the Spearman rank-correlation and test it for significance. Let = 0.05.
Free
(Essay)
4.8/5 (33)
Correct Answer:Verified
rs = -0.2
Z = 0.53; p-value = 0.5964; do not reject H0; no significant rank correlation
If a null hypothesis that states that two populations are identical is rejected using a nonparametric test, then it is safe to assume that
(Multiple Choice)
4.8/5 (34)
Exhibit 19-3
It is believed that the median yearly income in a suburb of Atlanta is $70,000. A sample of 67 residents was taken. Thirty-eight had yearly incomes above $70,000, 26 had yearly incomes below $70,000, and 3 had yearly incomes equal to $70,000. The null hypothesis to be tested is H0: median = $70,000.
-Refer to Exhibit 19-3. The p-value for this test is
(Multiple Choice)
4.7/5 (26)
Two groups of students were asked to rank the activities sponsored by the Student Government Association on campus. The following show their rankings. 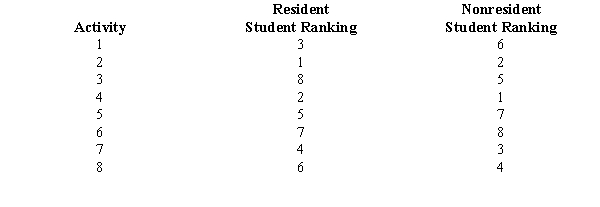 Determine the Spearman rank-correlation coefficient and test for a significant correlation with = 0.05.
(Essay)
4.9/5 (32)
The monthly sales records of two branches of a department store (Branch A and Branch B) over the last year (12 months) were gathered. It was decided to use the Mann-Whitney-Wilcoxon test to determine if there has been a significant difference between the sales of the two branches.
a.Provide the hypotheses for this test.
b.Compute the mean T.
c.Compute the standard deviation T.
d.The sum of the ranks for branch A was determined to be 184.5. Compute the test statistic Z.
e.Use = 0.05 and test to determine if there is a significant difference in the populations of the sales of the two branches.
(Essay)
4.9/5 (36)
The level of measurement that allows for the rank ordering of data items is
(Multiple Choice)
4.8/5 (33)
We want to see if the workers on the day and night shifts differ significantly in their productivity levels. A sample of workers from both shifts was taken. 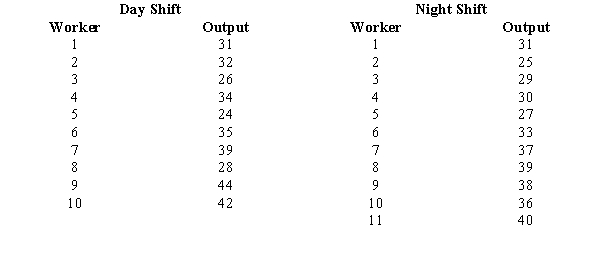 a.State the null and alternative hypotheses.
b.Test the null hypothesis at the 5% level of significance.
a.State the null and alternative hypotheses.
b.Test the null hypothesis at the 5% level of significance.
(Essay)
4.9/5 (38)
In a questionnaire, respondents are asked to mark their marital status. Marital status is an example of the
(Multiple Choice)
4.9/5 (36)
Exhibit 19-2
Students in statistics classes were asked whether they preferred a 10-minute break or to get out of class 10 minutes early. In a sample of 150 students, 40 preferred a 10-minute break, 80 preferred to get out 10 minutes early, and 30 had no preference. We want to determine if there is a difference in students' preferences.
-Refer to Exhibit 19-2. The test statistic based on the number of students who preferred to get out early equals
(Multiple Choice)
4.9/5 (38)
Exhibit 19-2
Students in statistics classes were asked whether they preferred a 10-minute break or to get out of class 10 minutes early. In a sample of 150 students, 40 preferred a 10-minute break, 80 preferred to get out 10 minutes early, and 30 had no preference. We want to determine if there is a difference in students' preferences.
-Refer to Exhibit 19-2. To test the null hypothesis, the appropriate probability distribution to use is the
(Multiple Choice)
4.9/5 (27)
A nonparametric method for determining the differences between two populations based on two matched samples where only preference data is required is the
(Multiple Choice)
4.7/5 (39)
Exhibit 19-6
Forty-one individuals from a sample of 60 indicated they oppose legalized abortion. We are interested in determining whether or not there is a significant difference between the proportions of opponents and proponents of legalized abortion.
-Refer to Exhibit 19-6. p-value is
(Multiple Choice)
4.7/5 (35)
The following data show the preference of 20 people for a candidate to a public office. A "+" indicates a preference for the Democratic candidate, and a "-" indicates a preference for the Republican candidate. 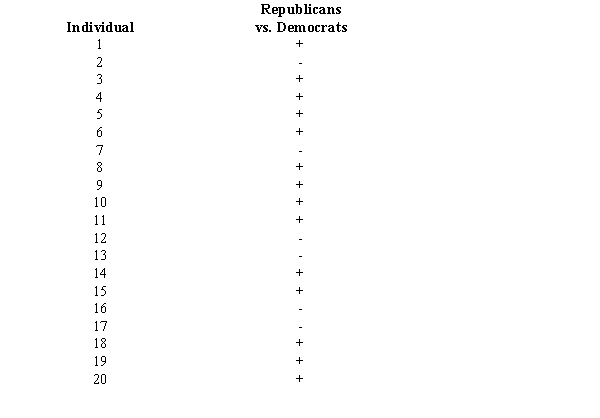 With = 0.05, test for a significant difference in the preference for the candidates.
(Essay)
4.9/5 (37)
Exhibit 19-6
Forty-one individuals from a sample of 60 indicated they oppose legalized abortion. We are interested in determining whether or not there is a significant difference between the proportions of opponents and proponents of legalized abortion.
-Refer to Exhibit 19-6. The null hypothesis that is being tested is
(Multiple Choice)
4.8/5 (34)
Exhibit 19-5
It has been hypothesized that there is no difference in the mathematical ability of men and women. To test this hypothesis, it was decided to use the Mann-Whitney-Wilcoxon test. A sample of men and women were given math tests. The scores on the tests are given below. 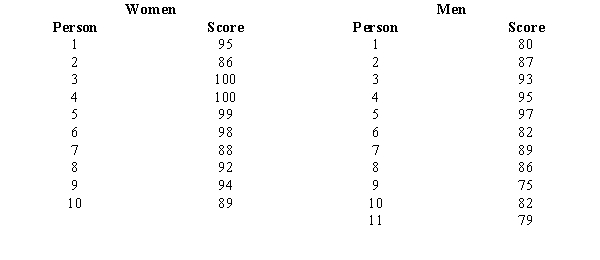 -Refer to Exhibit 19-5. The standard deviation ( T) is
(Multiple Choice)
4.9/5 (37)
Fifteen people were asked to indicate their preference for domestic versus imported cars. The following data showed their preferences. 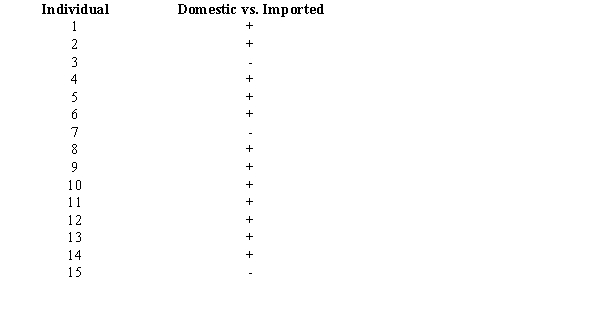 With = 0.05, test for a significant difference in the preferences for cars. A "+" indicates a preference for imported cars.
(Essay)
4.8/5 (42)
In a sample of 120 people, 50 indicated that they prefer domestic automobiles, 60 said they prefer foreign-made cars, and 10 indicated no difference in their preference. At a 0.05 level of significance, determine if there is evidence of a significant difference in the preferences for the two makes of automobiles.
(Essay)
4.8/5 (37)
Filters
- Essay(0)
- Multiple Choice(0)
- Short Answer(0)
- True False(0)
- Matching(0)