Exam 18: Nonparametric Methods
Exam 1: Data and Statistics98 Questions
Exam 2: Descriptive Statistics: Tabular and Graphical Displays62 Questions
Exam 3: Descriptive Statistics: Numerical Measures173 Questions
Exam 4: Introduction to Probability138 Questions
Exam 5: Discrete Probability Distributions123 Questions
Exam 6: Continuous Probability Distributions174 Questions
Exam 7: Sampling and Sampling Distributions133 Questions
Exam 8: Interval Estimation137 Questions
Exam 9: Hypothesis Tests148 Questions
Exam 10: Inference About Means and Proportions With Two Populations121 Questions
Exam 11: Inferences About Population Variances90 Questions
Exam 12: Comparing Multiple Proportions, Test of Independence and Goodness of Fit90 Questions
Exam 13: Experimental Design and Analysis of Variance115 Questions
Exam 14: Simple Linear Regression146 Questions
Exam 15: Multiple Regression115 Questions
Exam 16: Regression Analysis: Model Building76 Questions
Exam 17: Time Series Analysis and Forecasting68 Questions
Exam 18: Nonparametric Methods81 Questions
Exam 19: Statistical Methods for Quality Control29 Questions
Exam 20: Index Numbers52 Questions
Exam 21: Decision Analysis on Website65 Questions
Exam 22: Sample Survey on Website63 Questions
Select questions type
Exhibit 19-1
Fifteen people were given two types of cereal, Brand X and Brand Y. Two people preferred Brand X and thirteen people preferred Brand Y. We want to determine whether or not customers prefer one brand over the other.
-Refer to Exhibit 19-1. At 95% confidence, the null hypothesis should
(Multiple Choice)
4.7/5  (43)
(43)
Ten drivers were asked to drive two models of a car. Each car was given one gallon of gasoline. The distance that each automobile traveled on a gallon of gasoline is shown below. 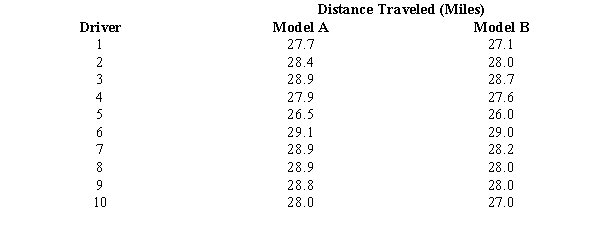 At = 0.05, what can be concluded about the performance of the two models?
(Essay)
5.0/5 (31)
The level of measurement that is simply a label for the purpose of identifying an item is
(Multiple Choice)
4.9/5 (35)
Exhibit 19-6
Forty-one individuals from a sample of 60 indicated they oppose legalized abortion. We are interested in determining whether or not there is a significant difference between the proportions of opponents and proponents of legalized abortion.
-Refer to Exhibit 19-6. The null hypothesis should be
(Multiple Choice)
4.8/5 (32)
Exhibit 19-1
Fifteen people were given two types of cereal, Brand X and Brand Y. Two people preferred Brand X and thirteen people preferred Brand Y. We want to determine whether or not customers prefer one brand over the other.
-Refer to Exhibit 19-1. The p-value for this test is
(Multiple Choice)
4.9/5 (38)
Exhibit 19-2
Students in statistics classes were asked whether they preferred a 10-minute break or to get out of class 10 minutes early. In a sample of 150 students, 40 preferred a 10-minute break, 80 preferred to get out 10 minutes early, and 30 had no preference. We want to determine if there is a difference in students' preferences.
-Refer to Exhibit 19-2. The mean and the standard deviation of the sampling distribution of the number of students who preferred to get out early are
(Multiple Choice)
4.7/5 (49)
Exhibit 19-2
Students in statistics classes were asked whether they preferred a 10-minute break or to get out of class 10 minutes early. In a sample of 150 students, 40 preferred a 10-minute break, 80 preferred to get out 10 minutes early, and 30 had no preference. We want to determine if there is a difference in students' preferences.
-Refer to Exhibit 19-2. The p-value for testing the hypotheses is
(Multiple Choice)
4.9/5 (40)
Exhibit 19-3
It is believed that the median yearly income in a suburb of Atlanta is $70,000. A sample of 67 residents was taken. Thirty-eight had yearly incomes above $70,000, 26 had yearly incomes below $70,000, and 3 had yearly incomes equal to $70,000. The null hypothesis to be tested is H0: median = $70,000.
-Refer to Exhibit 19-3. The null hypothesis should be
(Multiple Choice)
5.0/5 (33)
Independent random samples of ten day students and ten evening students at a university showed the following age distributions. We want to use the Mann-Whitney-Wilcoxon test to determine if there is a significant difference in the age distribution of the two groups.  a.Compute the sum of the ranks (T) for the day students.
b.Compute the mean T.
c.Compute T.
d..
Use = 0.05 and test for any significant differences in the age distribution of the two populations.
a.Compute the sum of the ranks (T) for the day students.
b.Compute the mean T.
c.Compute T.
d..
Use = 0.05 and test for any significant differences in the age distribution of the two populations.
(Essay)
4.8/5 (39)
Exhibit 19-2
Students in statistics classes were asked whether they preferred a 10-minute break or to get out of class 10 minutes early. In a sample of 150 students, 40 preferred a 10-minute break, 80 preferred to get out 10 minutes early, and 30 had no preference. We want to determine if there is a difference in students' preferences.
-Refer to Exhibit 19-2. The null hypothesis that is being tested is
(Multiple Choice)
4.8/5 (34)
Independent random samples of the scores of 10 daily quizzes from day students and 15 quizzes from evening students were gathered. It was decided to use the Mann-Whitney-Wilcoxon test to determine if there is a significant difference between the scores of the two groups of students.
a.Provide the hypotheses for this test.
b.Compute the mean T.
c.Compute the standard deviation T.
d.The sum of the ranks for the day students was determined to be 184.5. Compute the test statistic Z.
e.Use = 0.05 and test to determine if there is a significant difference in the populations of the scores of the two groups.
(Essay)
4.7/5 (28)
Which of the following tests would not be an example of a nonparametric method?
(Multiple Choice)
4.9/5 (30)
Statistical methods that generally require very few, if any, assumptions about the population distribution are known as
(Multiple Choice)
4.9/5 (41)
Exhibit 19-3
It is believed that the median yearly income in a suburb of Atlanta is $70,000. A sample of 67 residents was taken. Thirty-eight had yearly incomes above $70,000, 26 had yearly incomes below $70,000, and 3 had yearly incomes equal to $70,000. The null hypothesis to be tested is H0: median = $70,000.
-Refer to Exhibit 19-3. The mean and the standard deviation (respectively) for this test about the median are
(Multiple Choice)
4.8/5 (30)
Exhibit 19-4
A company advertises that food preparation time can be significantly reduced with the Handy Dandy Slicer. A sample of 12 individuals prepared the ingredients for a meal with and without the slicer. You are given the preparation times below. 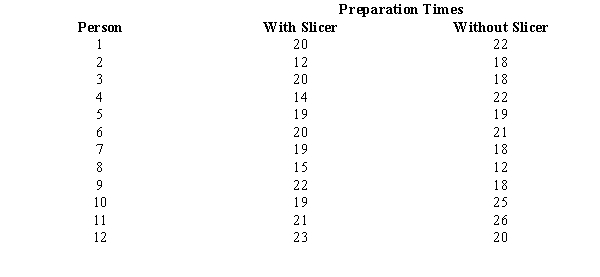 -Refer to Exhibit 19-4. The null hypothesis should
(Multiple Choice)
4.8/5 (36)
The sales records of two branches of a department store over the last 12 months are shown below. (Sales figures are in thousands of dollars.) We want to use the Mann-Whitney-Wilcoxon test to determine if there is a significant difference in the sales of the two branches. 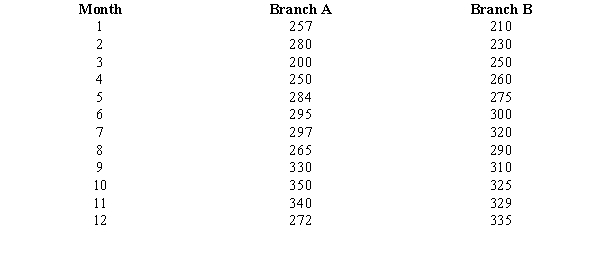 a.Compute the sum of the ranks (T) for branch A.
b.Compute the mean T.
c.Compute T.
d..
Use = 0.05 and test to determine if there is a significant difference in the populations of the sales of the two branches.
a.Compute the sum of the ranks (T) for branch A.
b.Compute the mean T.
c.Compute T.
d..
Use = 0.05 and test to determine if there is a significant difference in the populations of the sales of the two branches.
(Essay)
4.8/5 (46)
Exhibit 19-4
A company advertises that food preparation time can be significantly reduced with the Handy Dandy Slicer. A sample of 12 individuals prepared the ingredients for a meal with and without the slicer. You are given the preparation times below.
-Refer to Exhibit 19-4. To test the null hypothesis, the appropriate probability distribution to use is
(Multiple Choice)
4.7/5 (34)
The Spearman rank-correlation coefficient for 20 pairs of data when di2 = 50 is.
(Multiple Choice)
4.7/5 (45)
Two employers (A and B) ranked five candidates for a new position. Their rankings of the candidates are shown below.  Compute the Spearman rank-correlation and test it for significance. Let = 0.05.
(Essay)
4.8/5 (27)
Exhibit 19-4
A company advertises that food preparation time can be significantly reduced with the Handy Dandy Slicer. A sample of 12 individuals prepared the ingredients for a meal with and without the slicer. You are given the preparation times below.
-Refer to Exhibit 19-4. The p-value for this test is
(Multiple Choice)
4.8/5 (28)
Filters
- Essay(0)
- Multiple Choice(0)
- Short Answer(0)
- True False(0)
- Matching(0)