Exam 3: Descriptive Statistics: Numerical Measures
Exam 1: Data and Statistics98 Questions
Exam 2: Descriptive Statistics: Tabular and Graphical Displays62 Questions
Exam 3: Descriptive Statistics: Numerical Measures173 Questions
Exam 4: Introduction to Probability138 Questions
Exam 5: Discrete Probability Distributions123 Questions
Exam 6: Continuous Probability Distributions174 Questions
Exam 7: Sampling and Sampling Distributions133 Questions
Exam 8: Interval Estimation137 Questions
Exam 9: Hypothesis Tests148 Questions
Exam 10: Inference About Means and Proportions With Two Populations121 Questions
Exam 11: Inferences About Population Variances90 Questions
Exam 12: Comparing Multiple Proportions, Test of Independence and Goodness of Fit90 Questions
Exam 13: Experimental Design and Analysis of Variance115 Questions
Exam 14: Simple Linear Regression146 Questions
Exam 15: Multiple Regression115 Questions
Exam 16: Regression Analysis: Model Building76 Questions
Exam 17: Time Series Analysis and Forecasting68 Questions
Exam 18: Nonparametric Methods81 Questions
Exam 19: Statistical Methods for Quality Control29 Questions
Exam 20: Index Numbers52 Questions
Exam 21: Decision Analysis on Website65 Questions
Exam 22: Sample Survey on Website63 Questions
Select questions type
In 2012, the average donation to the Community Kitchen was $900 with a standard deviation of $180. In 2013, the average donation was $1,600 with a standard deviation of $240. In which year do the donations show a more dispersed distribution?
Free
(Essay)
4.8/5  (30)
(30)
Correct Answer: Verified
The coefficient of variation in 2012 was 20% (more dispersed). The coefficient of variation in 2013 was 15%.
The measure of dispersion which is not measured in the same units as the original data is the
Free
(Multiple Choice)
4.9/5 (36)
Correct Answer:Verified
D
Which of the following symbols represents the mean of the population?
Free
(Multiple Choice)
4.9/5 (42)
Correct Answer:Verified
C
The most frequently occurring value of a data set is called the
(Multiple Choice)
4.8/5 (39)
In the last month, Nancy purchased gasoline from four different gas stations. The following table shows the price per gallon and the gallons of gasoline that she purchased. 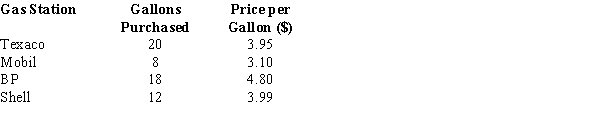 Determine the average price per gallon that Nancy paid for the gasoline.
(Short Answer)
4.8/5 (29)
From a population of size 1,000, a random sample of 100 items is selected. The mean of the sample
(Multiple Choice)
5.0/5 (27)
The following data show the yearly salaries of a sample of EMBA graduates. 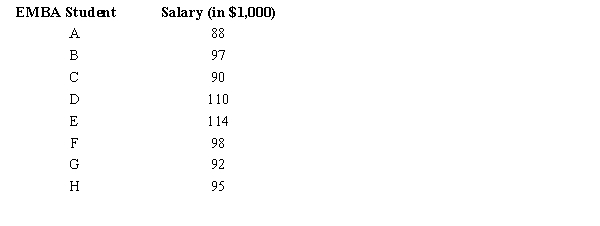 a.Compute the mean yearly salary and give your answer in dollars.
b.Compute the standard deviation and give your answer in dollars.
c.Compute the 75th percentile and give your answer in dollars. Fully explain what the value that you have determined indicates.
a.Compute the mean yearly salary and give your answer in dollars.
b.Compute the standard deviation and give your answer in dollars.
c.Compute the 75th percentile and give your answer in dollars. Fully explain what the value that you have determined indicates.
(Essay)
4.9/5 (39)
The ages of a sample of 8 faculty members selected from the School of Business Administration are shown below. 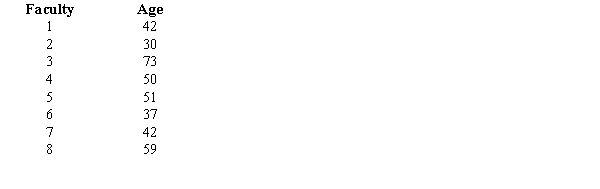 a.Compute the average age.
b.Determine the mode.
c.Compute the median age.
d.Compute the standard deviation.
a.Compute the average age.
b.Determine the mode.
c.Compute the median age.
d.Compute the standard deviation.
(Short Answer)
4.8/5 (29)
The following observations are given for two variables. 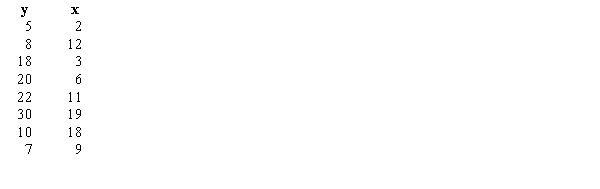 a.Compute and interpret the sample covariance for the above data.
b.Compute the standard deviation for x.
c.Compute the standard deviation for y.
d.Compute and interpret the sample correlation coefficient.
a.Compute and interpret the sample covariance for the above data.
b.Compute the standard deviation for x.
c.Compute the standard deviation for y.
d.Compute and interpret the sample correlation coefficient.
(Essay)
4.8/5 (36)
If index i (which is used to determine the location of the pth percentile) is not an integer, its value should be
(Multiple Choice)
4.7/5 (35)
Global Engineers hired the following number of Class 1 engineers during the first six months of the past year. (Assume the data represent a sample.)  a.Determine the mean, the median, the mode, and the range for the above data.
b.Compute the variance and the standard deviation.
c.Compute the first and the third quartiles.
d.Compute the z-scores for the months of May and June.
a.Determine the mean, the median, the mode, and the range for the above data.
b.Compute the variance and the standard deviation.
c.Compute the first and the third quartiles.
d.Compute the z-scores for the months of May and June.
(Essay)
4.8/5 (28)
Exhibit 3-2
A researcher has collected the following sample data
5 12 6 8 5
6 7 5 12 4
-Refer to Exhibit 3-2. The mode is
(Multiple Choice)
4.9/5 (33)
The measure of location which is the most likely to be influenced by extreme values in the data set is the
(Multiple Choice)
4.9/5 (31)
The following data represent the daily demand (y in thousands of units) and the unit price (x in dollars) for a product. 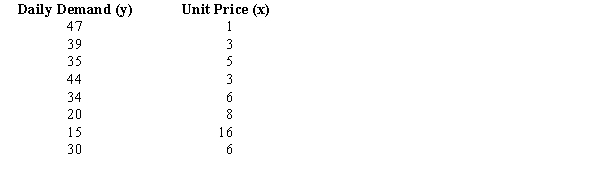 a.Compute and interpret the sample covariance for the above data.
b.Compute and interpret the sample correlation coefficient.
a.Compute and interpret the sample covariance for the above data.
b.Compute and interpret the sample correlation coefficient.
(Essay)
4.9/5 (39)
Filters
- Essay(0)
- Multiple Choice(0)
- Short Answer(0)
- True False(0)
- Matching(0)