Exam 13: Experimental Design and Analysis of Variance
Exam 1: Data and Statistics98 Questions
Exam 2: Descriptive Statistics: Tabular and Graphical Displays62 Questions
Exam 3: Descriptive Statistics: Numerical Measures173 Questions
Exam 4: Introduction to Probability138 Questions
Exam 5: Discrete Probability Distributions123 Questions
Exam 6: Continuous Probability Distributions174 Questions
Exam 7: Sampling and Sampling Distributions133 Questions
Exam 8: Interval Estimation137 Questions
Exam 9: Hypothesis Tests148 Questions
Exam 10: Inference About Means and Proportions With Two Populations121 Questions
Exam 11: Inferences About Population Variances90 Questions
Exam 12: Comparing Multiple Proportions, Test of Independence and Goodness of Fit90 Questions
Exam 13: Experimental Design and Analysis of Variance115 Questions
Exam 14: Simple Linear Regression146 Questions
Exam 15: Multiple Regression115 Questions
Exam 16: Regression Analysis: Model Building76 Questions
Exam 17: Time Series Analysis and Forecasting68 Questions
Exam 18: Nonparametric Methods81 Questions
Exam 19: Statistical Methods for Quality Control29 Questions
Exam 20: Index Numbers52 Questions
Exam 21: Decision Analysis on Website65 Questions
Exam 22: Sample Survey on Website63 Questions
Select questions type
Part of an ANOVA table is shown below. 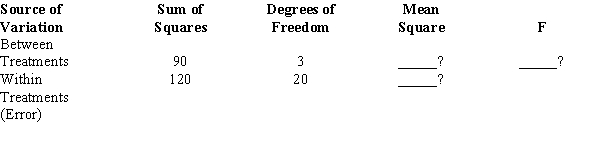 a.Compute the missing values and fill in the blanks in the above table. Use = .01 to determine if there is any significant difference among the means.
b.How many groups have there been in this problem?
c.What has been the total number of observations?
a.Compute the missing values and fill in the blanks in the above table. Use = .01 to determine if there is any significant difference among the means.
b.How many groups have there been in this problem?
c.What has been the total number of observations?
Free
(Essay)
4.9/5  (32)
(32)
Correct Answer: Verified
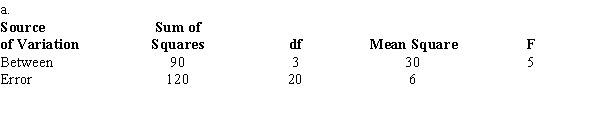 F = 5; p-value is less than 0.01; reject H0 (critical F = 4.84)
b.4
c.24
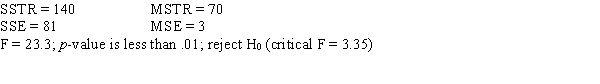
Three different brands of tires were compared for wear characteristics. From each brand of tire, ten tires were randomly selected and subjected to standard wear-testing procedures. The average mileage obtained for each brand of tire and sample variances (both in 1,000 miles) are shown below. 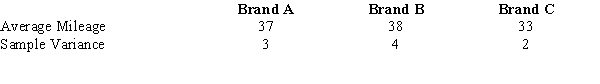 At 95% confidence, test to see if there is a significant difference in the average mileage of the three brands.
Free
(Essay)
4.9/5 (42)
Correct Answer:Verified
The following are the results from a completely randomized design consisting of 3 treatments. 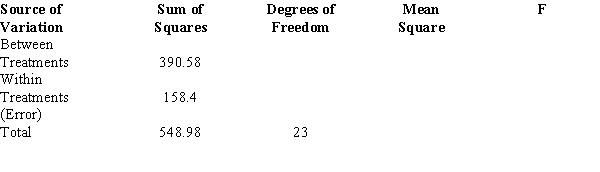 a.Using = .05, test to see if there is a significant difference among the means of the three populations. The sample sizes for the three treatments are equal.
b.If in Part a you concluded that at least one mean is different from the others, determine which mean(s) is(are) different. The three sample means are
a.Using = .05, test to see if there is a significant difference among the means of the three populations. The sample sizes for the three treatments are equal.
b.If in Part a you concluded that at least one mean is different from the others, determine which mean(s) is(are) different. The three sample means are 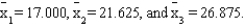 Use Fisher's LSD procedure and let = .05.
Free
(Essay)
4.9/5 (32)
Correct Answer:Verified
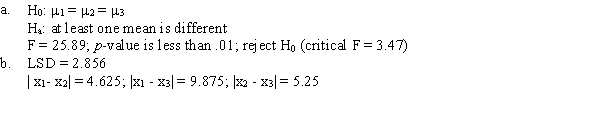 All three means are different from one another.
Exhibit 13-2 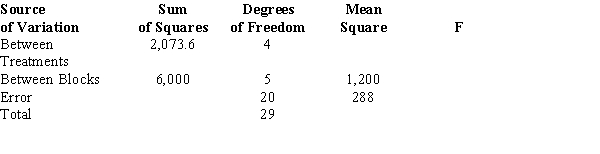 -Refer to Exhibit 13-2. The test statistic to test the null hypothesis equals
(Multiple Choice)
4.9/5 (32)
Exhibit 13-6
Part of an ANOVA table is shown below. 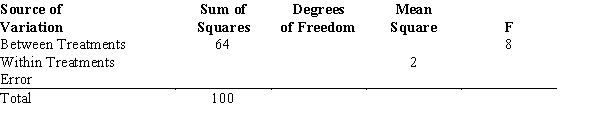 -Refer to Exhibit 13-6. The number of degrees of freedom corresponding to within treatments is
(Multiple Choice)
4.8/5 (47)
Exhibit 13-7
The following is part of an ANOVA table that was obtained from data regarding three treatments and a total of 15 observations. 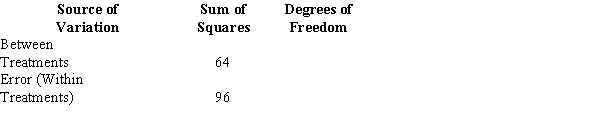 -Refer to Exhibit 13-7. The number of degrees of freedom corresponding to within treatments is
(Multiple Choice)
5.0/5 (32)
An experimental design where the experimental units are randomly assigned to the treatments is known as
(Multiple Choice)
4.7/5 (50)
A factorial experiment involving 2 levels of factor A and 2 levels of factor B resulted in the following. 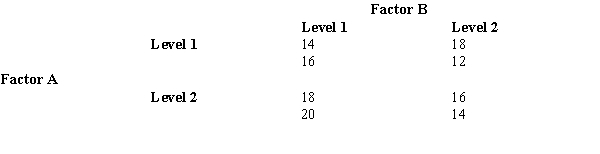 Set up an ANOVA table and test for any significant main effect and any interaction effect. Use = .05.
(Essay)
4.9/5 (37)
Exhibit 13-5
Part of an ANOVA table is shown below. 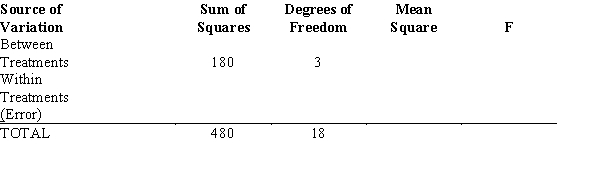 -Refer to Exhibit 13-5. The mean square within treatments (MSE) is
(Multiple Choice)
4.8/5 (28)
Exhibit 13-6
Part of an ANOVA table is shown below.
-Refer to Exhibit 13-6. If at 95% confidence we want to determine whether or not the means of the populations are equal, the p-value is
(Multiple Choice)
4.8/5 (33)
Information regarding the ACT scores of samples of students in three different majors is given below. 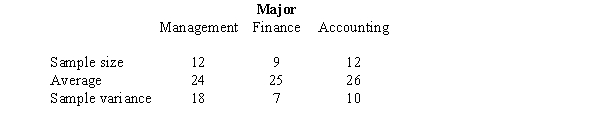 a.Compute the overall sample mean
  .
b.Set up the ANOVA table for this problem including the test statistic.
c.At 95% confidence, determine the critical value of F.
d.Using the critical value approach, test to determine whether there is a significant difference in the means of the three populations.
e.Determine the p-value and use it for the test.
.
b.Set up the ANOVA table for this problem including the test statistic.
c.At 95% confidence, determine the critical value of F.
d.Using the critical value approach, test to determine whether there is a significant difference in the means of the three populations.
e.Determine the p-value and use it for the test.
(Essay)
4.9/5 (34)
The critical F value with 6 numerator and 60 denominator degrees of freedom at = .05 is
(Multiple Choice)
4.9/5 (42)
Exhibit 13-7
The following is part of an ANOVA table that was obtained from data regarding three treatments and a total of 15 observations.
-Refer to Exhibit 13-7. The number of degrees of freedom corresponding to between treatments is
(Multiple Choice)
4.9/5 (33)
Random samples of individuals from three different cities were asked how much time they spend per day watching television. The results (in minutes) for the three groups are shown below. 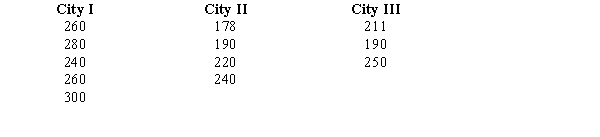 At = 0.05, test to see if there is a significant difference in the averages of the three groups.
(Essay)
4.9/5 (42)
Exhibit 13-5
Part of an ANOVA table is shown below.
-Refer to Exhibit 13-5. If at 95% confidence, we want to determine whether or not the means of the populations are equal, the p-value is
(Multiple Choice)
4.9/5 (29)
Eight observations were selected from each of 3 populations (total of 24 observations), and an analysis of variance was performed on the data. The following are part of the results. 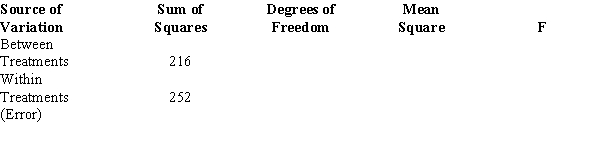 Using = .05, test to see if there is a significant difference among the means of the three populations.
(Essay)
4.8/5 (38)
Five drivers were selected to test drive 2 makes of automobiles. The following table shows the number of miles per gallon for each driver driving each car. 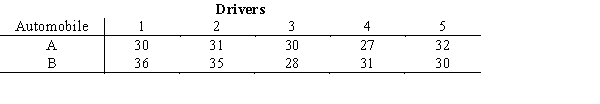 Consider the makes of automobiles as treatments and the drivers as blocks, test to see if there is any difference in the miles/gallon of the two makes of automobiles. Let = .05.
(Essay)
4.9/5 (38)
In an analysis of variance, one estimate of 2is based upon the differences between the treatment means and the
(Multiple Choice)
4.9/5 (39)
Exhibit 13-7
The following is part of an ANOVA table that was obtained from data regarding three treatments and a total of 15 observations.
-Refer to Exhibit 13-7. If at 95% confidence, we want to determine whether or not the means of the populations are equal, the p-value is
(Multiple Choice)
4.8/5 (33)
Filters
- Essay(0)
- Multiple Choice(0)
- Short Answer(0)
- True False(0)
- Matching(0)