Exam 14: Simple Linear Regression
Exam 1: Data and Statistics98 Questions
Exam 2: Descriptive Statistics: Tabular and Graphical Displays62 Questions
Exam 3: Descriptive Statistics: Numerical Measures173 Questions
Exam 4: Introduction to Probability138 Questions
Exam 5: Discrete Probability Distributions123 Questions
Exam 6: Continuous Probability Distributions174 Questions
Exam 7: Sampling and Sampling Distributions133 Questions
Exam 8: Interval Estimation137 Questions
Exam 9: Hypothesis Tests148 Questions
Exam 10: Inference About Means and Proportions With Two Populations121 Questions
Exam 11: Inferences About Population Variances90 Questions
Exam 12: Comparing Multiple Proportions, Test of Independence and Goodness of Fit90 Questions
Exam 13: Experimental Design and Analysis of Variance115 Questions
Exam 14: Simple Linear Regression146 Questions
Exam 15: Multiple Regression115 Questions
Exam 16: Regression Analysis: Model Building76 Questions
Exam 17: Time Series Analysis and Forecasting68 Questions
Exam 18: Nonparametric Methods81 Questions
Exam 19: Statistical Methods for Quality Control29 Questions
Exam 20: Index Numbers52 Questions
Exam 21: Decision Analysis on Website65 Questions
Exam 22: Sample Survey on Website63 Questions
Select questions type
If only MSE is known, you can compute the
Free
(Multiple Choice)
4.9/5  (30)
(30)
Correct Answer: Verified
C
Exhibit 14-9
A regression and correlation analysis resulted in the following information regarding a dependent variable (y) and an independent variable (x). 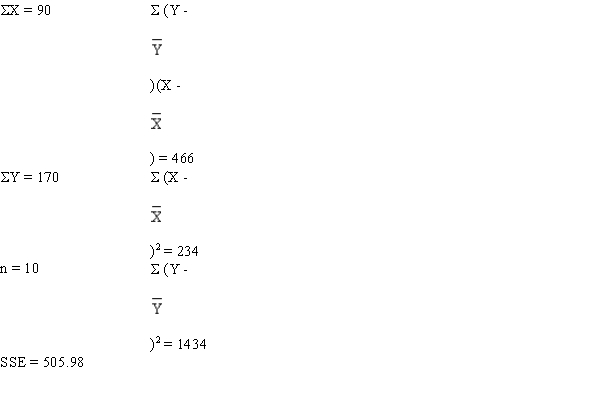 -Refer to Exhibit 14-9. The coefficient of determination equals
Free
(Multiple Choice)
4.8/5 (35)
Correct Answer:Verified
A
Regression analysis was applied between sales (in $10,000) and advertising (in $100) and the following regression function was obtained.  = 50 + 8 X Based on the above estimated regression line if advertising is $1,000, then the point estimate for sales (in dollars) is
Free
(Multiple Choice)
4.7/5 (43)
Correct Answer:Verified
D
Regression analysis was applied between sales (Y in $1,000) and advertising (X in $100), and the following estimated regression equation was obtained.  = 80 + 6.2 X Based on the above estimated regression line, if advertising is $10,000, then the point estimate for sales (in dollars) is
(Multiple Choice)
4.9/5 (40)
The following data shows the yearly income (in $1,000) and age of a sample of seven individuals. 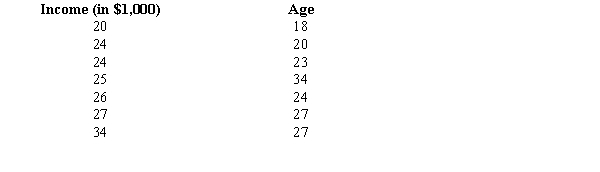 a.Develop the least squares regression equation.
b.Estimate the yearly income of a 30-year-old individual.
c.Compute the coefficient of determination.
d.Use a t test to determine whether the slope is significantly different from zero. Let = 0.05.
e.At 95% confidence, perform an F test and determine whether or not the model is significant.
a.Develop the least squares regression equation.
b.Estimate the yearly income of a 30-year-old individual.
c.Compute the coefficient of determination.
d.Use a t test to determine whether the slope is significantly different from zero. Let = 0.05.
e.At 95% confidence, perform an F test and determine whether or not the model is significant.
(Essay)
4.7/5 (30)
Shown below is a portion of a computer output for regression analysis relating Y (dependent variable) and X (independent variable). 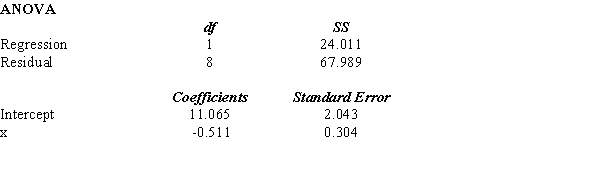 a. What has been the sample size for the above?
b. Perform a t test and determine whether or not X and Y are related. Let = 0.05.
c. Perform an F test and determine whether or not X and Y are related. Let = 0.05.
d. Compute the coefficient of determination.
e. Interpret the meaning of the value of the coefficient of determination that you found in d. Be very specific.
a. What has been the sample size for the above?
b. Perform a t test and determine whether or not X and Y are related. Let = 0.05.
c. Perform an F test and determine whether or not X and Y are related. Let = 0.05.
d. Compute the coefficient of determination.
e. Interpret the meaning of the value of the coefficient of determination that you found in d. Be very specific.
(Essay)
4.8/5 (37)
The owner of a retail store randomly selected the following weekly data on profits and advertising cost. 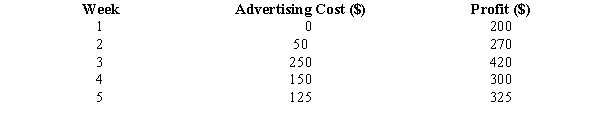 a.Write down the appropriate linear relationship between advertising cost and profits. Which is the dependent variable? Which is the independent variable?
b.Calculate the least squares estimated regression line.
c.Predict the profits for a week when $200 is spent on advertising.
d.At 95% confidence, test to determine if the relationship between advertising costs and profits is statistically significant.
e.Calculate the coefficient of determination.
a.Write down the appropriate linear relationship between advertising cost and profits. Which is the dependent variable? Which is the independent variable?
b.Calculate the least squares estimated regression line.
c.Predict the profits for a week when $200 is spent on advertising.
d.At 95% confidence, test to determine if the relationship between advertising costs and profits is statistically significant.
e.Calculate the coefficient of determination.
(Essay)
4.8/5 (28)
Exhibit 14-8
The following information regarding a dependent variable Y and an independent variable X is provided 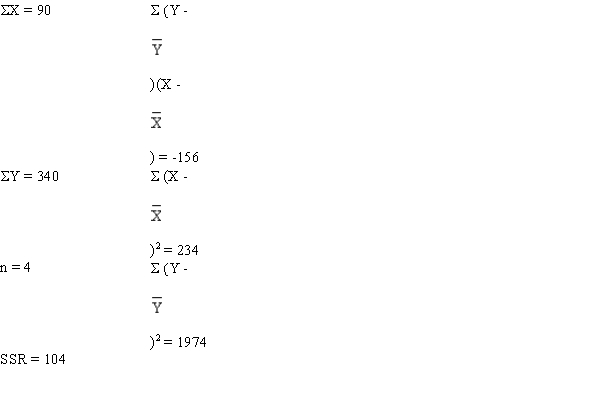 -Refer to Exhibit 14-8. The Y intercept is
(Multiple Choice)
4.8/5 (34)
In simple linear regression analysis, which of the following is not true?
(Multiple Choice)
4.9/5 (32)
Exhibit 14-6
For the following data the value of SSE = 0.4130. 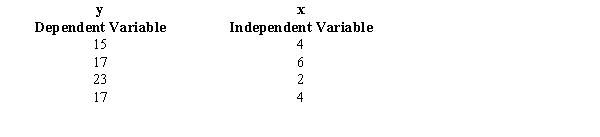 -Refer to Exhibit 14-6. The coefficient of determination (r2) equals
(Multiple Choice)
4.7/5 (31)
In regression analysis, the variable that is being predicted is the
(Multiple Choice)
4.9/5 (28)
Given below are five observations collected in a regression study on two variables, x (independent variable) and y (dependent variable). 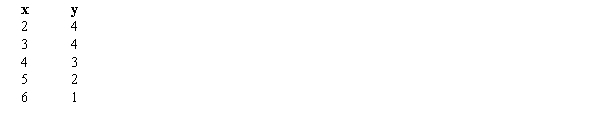 a.Develop the least squares estimated regression equation.
b.At 95% confidence, perform a t test and determine whether or not the slope is significantly different from zero.
c.Perform an F test to determine whether or not the model is significant. Let = 0.05.
d.Compute the coefficient of determination.
e.Compute the coefficient of correlation.
a.Develop the least squares estimated regression equation.
b.At 95% confidence, perform a t test and determine whether or not the slope is significantly different from zero.
c.Perform an F test to determine whether or not the model is significant. Let = 0.05.
d.Compute the coefficient of determination.
e.Compute the coefficient of correlation.
(Essay)
4.7/5 (40)
Exhibit 14-9
A regression and correlation analysis resulted in the following information regarding a dependent variable (y) and an independent variable (x).
-Refer to Exhibit 14-9. The least squares estimate of b0 equals
(Multiple Choice)
4.9/5 (19)
If the coefficient of correlation is 0.8, the percentage of variation in the dependent variable explained by the variation in the independent variable is
(Multiple Choice)
4.7/5 (33)
Exhibit 14-2
You are given the following information about y and x. 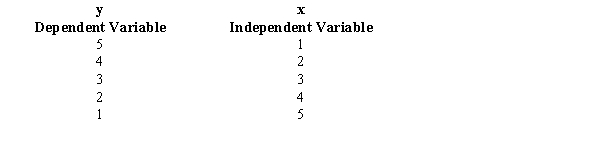 -Refer to Exhibit 14-2. The coefficient of determination equals
(Multiple Choice)
4.8/5 (37)
Exhibit 14-10
The following information regarding a dependent variable Y and an independent variable X is provided. 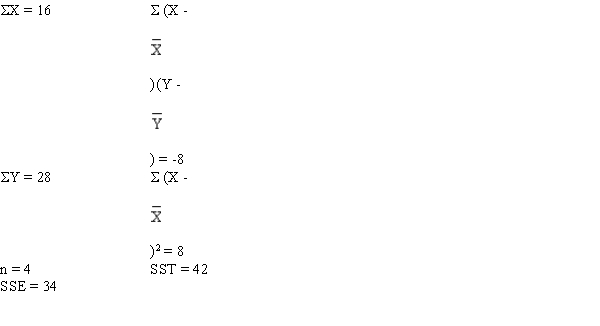 -Refer to Exhibit 14-10. The coefficient of determination is
(Multiple Choice)
4.9/5 (37)
If all the points of a scatter diagram lie on the least squares regression line, then the coefficient of determination for these variables based on these data is
(Multiple Choice)
4.8/5 (39)
Exhibit 14-9
A regression and correlation analysis resulted in the following information regarding a dependent variable (y) and an independent variable (x).
-Refer to Exhibit 14-9. The sample correlation coefficient equals
(Multiple Choice)
4.9/5 (36)
Filters
- Essay(0)
- Multiple Choice(0)
- Short Answer(0)
- True False(0)
- Matching(0)