Exam 19: Statistical Methods for Quality Control
Exam 1: Data and Statistics98 Questions
Exam 2: Descriptive Statistics: Tabular and Graphical Displays62 Questions
Exam 3: Descriptive Statistics: Numerical Measures173 Questions
Exam 4: Introduction to Probability138 Questions
Exam 5: Discrete Probability Distributions123 Questions
Exam 6: Continuous Probability Distributions174 Questions
Exam 7: Sampling and Sampling Distributions133 Questions
Exam 8: Interval Estimation137 Questions
Exam 9: Hypothesis Tests148 Questions
Exam 10: Inference About Means and Proportions With Two Populations121 Questions
Exam 11: Inferences About Population Variances90 Questions
Exam 12: Comparing Multiple Proportions, Test of Independence and Goodness of Fit90 Questions
Exam 13: Experimental Design and Analysis of Variance115 Questions
Exam 14: Simple Linear Regression146 Questions
Exam 15: Multiple Regression115 Questions
Exam 16: Regression Analysis: Model Building76 Questions
Exam 17: Time Series Analysis and Forecasting68 Questions
Exam 18: Nonparametric Methods81 Questions
Exam 19: Statistical Methods for Quality Control29 Questions
Exam 20: Index Numbers52 Questions
Exam 21: Decision Analysis on Website65 Questions
Exam 22: Sample Survey on Website63 Questions
Select questions type
A control chart that is used when the output of a production process is measured in terms of the percent defective is
Free
(Multiple Choice)
4.9/5  (46)
(46)
Correct Answer: Verified
A
A production process is considered in control if no more than 4% of the items produced are defective. Samples of size 100 are used for the inspection process.
a.Determine the standard error of the proportion.
b.Determine the upper and the lower control limits for the P chart.
Free
(Essay)
4.8/5 (32)
Correct Answer:Verified
a.0.0196 (rounded)
b.UCL = 0.0988
LCL = 0.0000
Note: Since the lower control limit is negative, it is set equal to zero.
The results of inspection of samples of a product taken over the past 8 days are given below. Sample size for each day has been 120. 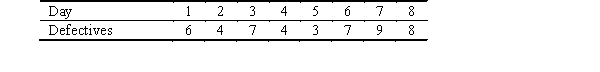 Determine the 97% upper and lower control limits for the p-chart.
Free
(Short Answer)
4.8/5 (35)
Correct Answer:Verified
LCL = 0.006827
UCL = 0.093173
The upper and lower control limits of the proportions of defectives of a process are 0.0803 and 0.0161
a.What has been the proportion of defectives in this process?
b.What has been the sample size?
c.Determine the standard error of proportion.
(Essay)
4.9/5 (40)
The maximum number of defective items that can be found in the sample and still lead to acceptance of the lot is
(Multiple Choice)
4.9/5 (29)
A soft drink filling machine is set up to fill bottles with 12 ounces of soft drink. The standard deviation s is known to be 0.4 ounces. The quality control department periodically selects samples of 16 bottles and measures their contents. Assume the distribution of filling volumes is normal.
a.Determine the upper and lower control limits and explain what they indicate.
b.The means of six samples were 11.8, 12.2, 11.9, 11.9, 12.1, and 11.8 ounces. Construct an X bar chart and indicate whether or not the process is in control.
(Essay)
4.9/5 (36)
A graph showing the probability of accepting the lot as a function of the percent defective in the lot is
(Multiple Choice)
4.9/5 (35)
In acceptance sampling, the risk of rejecting a good quality lot is known as
(Multiple Choice)
4.8/5 (36)
The upper and lower control limits of the mean of a process are 66 and 54. Samples of size 16 are used for the inspection process. Determine the mean and the standard deviation for this process.
(Short Answer)
4.8/5 (43)
The upper and lower control limits of the mean of a process are 606 and 594. Samples of size 225 are used for the inspection process. Determine the mean and the standard deviation for this process.
(Short Answer)
4.8/5 (38)
In acceptance sampling, the risk of accepting a poor quality lot is known as
(Multiple Choice)
5.0/5 (35)
Brakes Shop, Inc., is a franchise that specializes in repairing brake systems of automobiles. The company purchases brake shoes from a national supplier. Currently, lots of 1,000 brake shoes are purchased, and each shoe is inspected before being installed on an automobile. The company has decided instead of 100% inspection to adopt an acceptance sampling plan.
a.Explain what is meant by the acceptance sampling plan.
b.If the company decides to adopt an acceptance sampling plan, what kinds of risks are there?
c.The quality control department of the company has decided to select a sample of 10 shoes and inspect them for defects. Furthermore, it has been decided that if the sample contains no defective parts, the entire lot will be accepted. If there are 50 defective shoes in a shipment, what is the probability that the entire lot will be accepted?
d.What is the probability of accepting the lot if there are 100 defective units in the lot?
(Essay)
4.8/5 (39)
Normal or natural variations in process outputs that are due purely to chance are
(Multiple Choice)
4.8/5 (26)
A group of items such as incoming shipments of raw material is called a(n)
(Multiple Choice)
4.9/5 (28)
A production process that is in control has a mean ( ) of 80 and a standard deviation ( ) of 10.
a.Determine the upper and the lower control limits for sample sizes of 25.
b.Five samples had means of 81, 84, 75, 83, and 79. Construct an X bar chart and explain whether or not the process is in control.
(Essay)
4.7/5 (33)
The upper and lower control limits of the proportions of defectives of a process are 0.13 and 0.07.
a.What has been the proportion of defectives in this process?
b.What has been the sample size?
(Short Answer)
4.9/5 (41)
Nancy, Inc. manufactures 4 ounce chocolate bars. Random samples of size four were taken and weighed. Eight hours of observation provided the following data. 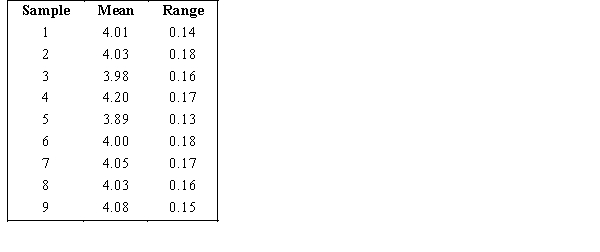 a. Determine the 3 sigma upper and lower control limits for the x-bar chart.
b. Determine the 3 sigma upper and lower control limits for the R-chart.
a. Determine the 3 sigma upper and lower control limits for the x-bar chart.
b. Determine the 3 sigma upper and lower control limits for the R-chart.
(Essay)
4.9/5 (41)
The upper and lower control limits of the proportions of defectives of a process are 0.33 and 0.27.
a.What has been the proportion of defectives in this process?
b.What has been the sample size?
(Short Answer)
4.9/5 (35)
Filters
- Essay(0)
- Multiple Choice(0)
- Short Answer(0)
- True False(0)
- Matching(0)