Exam 10: Inference About Means and Proportions With Two Populations
Exam 1: Data and Statistics98 Questions
Exam 2: Descriptive Statistics: Tabular and Graphical Displays62 Questions
Exam 3: Descriptive Statistics: Numerical Measures173 Questions
Exam 4: Introduction to Probability138 Questions
Exam 5: Discrete Probability Distributions123 Questions
Exam 6: Continuous Probability Distributions174 Questions
Exam 7: Sampling and Sampling Distributions133 Questions
Exam 8: Interval Estimation137 Questions
Exam 9: Hypothesis Tests148 Questions
Exam 10: Inference About Means and Proportions With Two Populations121 Questions
Exam 11: Inferences About Population Variances90 Questions
Exam 12: Comparing Multiple Proportions, Test of Independence and Goodness of Fit90 Questions
Exam 13: Experimental Design and Analysis of Variance115 Questions
Exam 14: Simple Linear Regression146 Questions
Exam 15: Multiple Regression115 Questions
Exam 16: Regression Analysis: Model Building76 Questions
Exam 17: Time Series Analysis and Forecasting68 Questions
Exam 18: Nonparametric Methods81 Questions
Exam 19: Statistical Methods for Quality Control29 Questions
Exam 20: Index Numbers52 Questions
Exam 21: Decision Analysis on Website65 Questions
Exam 22: Sample Survey on Website63 Questions
Select questions type
Exhibit 10-13
In order to determine whether or not there is a significant difference between the hourly wages of two companies, the following data have been accumulated. 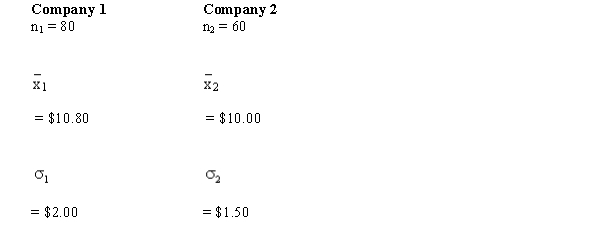 -Refer to Exhibit 10-13. The test statistic has a value of
Free
(Multiple Choice)
4.8/5  (34)
(34)
Correct Answer: Verified
D
In order to determine whether or not a driver's education course improves the scores on a driving exam, a sample of 6 students were given the exam before and after taking the course. The results are shown below.
Let d = Score After - Score Before. 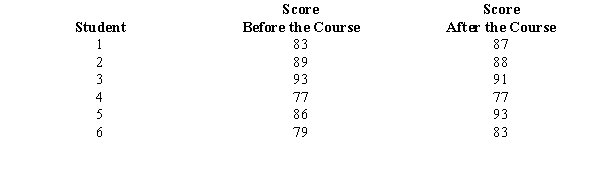 a.Compute the test statistic.
b.At 95% confidence using the p-value approach, test to see if taking the course actually increased scores on the driving exam.
a.Compute the test statistic.
b.At 95% confidence using the p-value approach, test to see if taking the course actually increased scores on the driving exam.
Free
(Essay)
4.7/5 (41)
Correct Answer:Verified
a.Test statistic t = 1.391
b.p-value (0.111) is between 0.1 and 0.2, do not reject H0 and conclude that there is not sufficient evidence to show that the course increased the scores.
Of 200 UTC seniors surveyed, 60 were planning on attending Graduate School. At UTK, 400 seniors were surveyed and 100 indicated that they were planning to attend Graduate School.
a.Determine a 95% confidence interval estimate for the difference between the proportion of seniors at the two universities that were planning to attend Graduate School.
b.Is there conclusive evidence to prove that the proportion of students from UTC who plan to go to Graduate School is significantly more than those from UTK? Explain.
Free
(Essay)
4.9/5 (30)
Correct Answer:Verified
a.-0.026 to 0.126
b.No, the range of the interval is from a negative to a positive value.
Exhibit 10-13
In order to determine whether or not there is a significant difference between the hourly wages of two companies, the following data have been accumulated.
-Refer to Exhibit 10-13. The null hypothesis for this test is
(Multiple Choice)
5.0/5 (37)
Independent simple random samples are taken to test the difference between the means of two populations whose variances are not known, but are assumed to be equal. The sample sizes are n1 = 32 and n2 = 40. The correct distribution to use is the
(Multiple Choice)
4.9/5 (43)
Of 150 Chattanooga residents surveyed, 60 indicated that they participated in a recycling program. In Knoxville, 120 residents were surveyed and 36 claimed to recycle.
a.Determine a 95% confidence interval estimate for the difference between the proportion of residents recycling in the two cities.
b.From your answer in Part a, is there sufficient evidence to conclude that there is a significant difference in the proportion of residents participating in a recycling program?
(Essay)
4.8/5 (34)
Exhibit 10-4
The following information was obtained from independent random samples.
Assume normally distributed populations with equal variances.  -Refer to Exhibit 10-4. The point estimate for the difference between the means of the two populations is
(Multiple Choice)
4.9/5 (33)
Consider the following results for two samples randomly taken from two normal populations with equal variances. 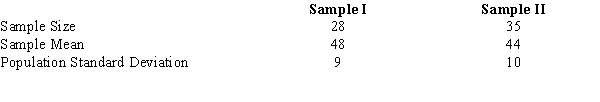 a.Develop a 95% confidence interval for the difference between the two population means.
b.Is there conclusive evidence that one population has a larger mean? Explain.
a.Develop a 95% confidence interval for the difference between the two population means.
b.Is there conclusive evidence that one population has a larger mean? Explain.
(Essay)
4.8/5 (46)
Exhibit 10-5
The following information was obtained from matched samples.  -Refer to Exhibit 10-5. The 95% confidence interval for the difference between the two population means is
(Multiple Choice)
4.8/5 (32)
Consider the following results for two samples randomly taken from two populations. 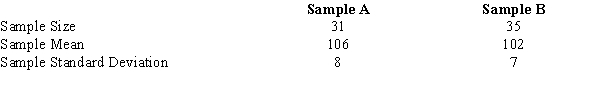 a.Determine the degrees of freedom for the t-distribution.
b.Develop a 95% confidence interval for the difference between the two population means.
a.Determine the degrees of freedom for the t-distribution.
b.Develop a 95% confidence interval for the difference between the two population means.
(Short Answer)
4.9/5 (41)
The following sample information is given concerning the ACT scores of high school seniors form two local schools. 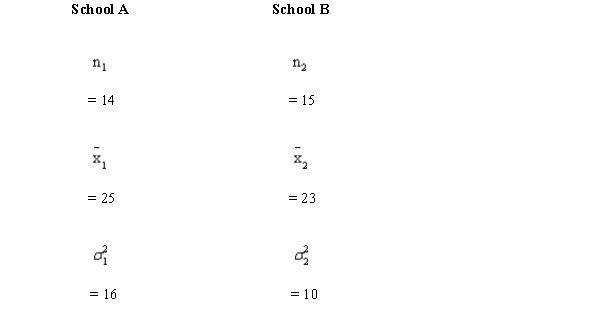 Develop a 95% confidence interval estimate for the difference between the two populations.
(Short Answer)
4.9/5 (29)
Babies weighing less than 5.5 pounds at birth are considered "low-birth-weight babies." In the United States, 7.6% of newborns are low-birth-weight babies. The following information was accumulated from samples of new births taken from two counties.  a.Develop a 95% confidence interval estimate for the difference between the proportions of low-birth-weight babies in the two counties.
b.Is there conclusive evidence that one of the proportions is significantly more than the other? If yes, which county? Explain, using the results of part (a). Do not perform any test.
a.Develop a 95% confidence interval estimate for the difference between the proportions of low-birth-weight babies in the two counties.
b.Is there conclusive evidence that one of the proportions is significantly more than the other? If yes, which county? Explain, using the results of part (a). Do not perform any test.
(Essay)
4.8/5 (27)
In order to estimate the difference between the average Miles per Gallon of two different models of automobiles, samples are taken and the following information is collected.  a.At 95% confidence develop an interval estimate for the difference between the average Miles per Gallon for the two models.
b.Is there conclusive evidence to indicate that one model gets a higher MPG than the other? Why or why not? Explain.
a.At 95% confidence develop an interval estimate for the difference between the average Miles per Gallon for the two models.
b.Is there conclusive evidence to indicate that one model gets a higher MPG than the other? Why or why not? Explain.
(Essay)
4.9/5 (39)
Exhibit 10-6
The management of a department store is interested in estimating the difference between the mean credit purchases of customers using the store's credit card versus those customers using a national major credit card. You are given the following information. 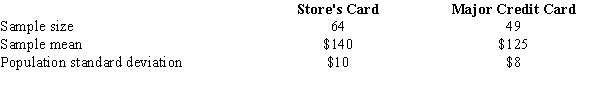 -Refer to Exhibit 10-6. At 95% confidence, the margin of error is
(Multiple Choice)
4.9/5 (32)
If we are interested in testing whether the proportion of items in population 1 is larger than the proportion of items in population 2, the
(Multiple Choice)
4.8/5 (31)
Two independent samples are drawn from two populations, and the following information is provided.  We want to test the following hypotheses.
H0: 1 - F1 2 0
Ha: 1 - 2 < 0
a.Determine the degrees of freedom.
b.Compute the test statistic.
c.At 95% confidence, test the hypotheses. Assume the two populations are normally distributed and have equal variances.
We want to test the following hypotheses.
H0: 1 - F1 2 0
Ha: 1 - 2 < 0
a.Determine the degrees of freedom.
b.Compute the test statistic.
c.At 95% confidence, test the hypotheses. Assume the two populations are normally distributed and have equal variances.
(Essay)
4.8/5 (34)
When each data value in one sample is matched with a corresponding data value in another sample, the samples are known as
(Multiple Choice)
4.9/5 (34)
Independent random samples of managers' yearly salaries (in $1000) taken from governmental and private organizations provided the following information. At 95% confidence, test to determine if there is a significant difference between the average salaries of the managers in the two sectors. 
(Essay)
4.8/5 (32)
A test on world history was given to a group of individuals before and also after a film on the history of the world was presented. The results are given below. We want to determine if the film significantly increased the test scores. (For the following matched samples, let the difference "d" be d = after - before.) 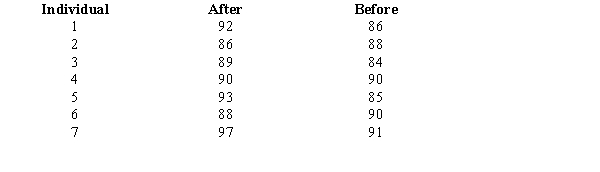 a.Give the hypotheses for this problem.
b.Compute the test statistic.
c.At 95% confidence, test the hypotheses.
a.Give the hypotheses for this problem.
b.Compute the test statistic.
c.At 95% confidence, test the hypotheses.
(Essay)
4.7/5 (25)
Filters
- Essay(0)
- Multiple Choice(0)
- Short Answer(0)
- True False(0)
- Matching(0)