Exam 18: Simple Linear Regression and Correlation
Exam 1: What Is Statistics14 Questions
Exam 2: Types of Data, Data Collection and Sampling16 Questions
Exam 3: Graphical Descriptive Methods Nominal Data19 Questions
Exam 4: Graphical Descriptive Techniques Numerical Data64 Questions
Exam 5: Numerical Descriptive Measures147 Questions
Exam 6: Probability106 Questions
Exam 7: Random Variables and Discrete Probability Distributions55 Questions
Exam 8: Continuous Probability Distributions117 Questions
Exam 9: Statistical Inference: Introduction8 Questions
Exam 10: Sampling Distributions65 Questions
Exam 11: Estimation: Describing a Single Population127 Questions
Exam 12: Estimation: Comparing Two Populations22 Questions
Exam 13: Hypothesis Testing: Describing a Single Population129 Questions
Exam 14: Hypothesis Testing: Comparing Two Populations78 Questions
Exam 15: Inference About Population Variances49 Questions
Exam 16: Analysis of Variance115 Questions
Exam 17: Additional Tests for Nominal Data: Chi-Squared Tests110 Questions
Exam 18: Simple Linear Regression and Correlation213 Questions
Exam 19: Multiple Regression121 Questions
Exam 20: Model Building92 Questions
Exam 21: Nonparametric Techniques126 Questions
Exam 22: Statistical Inference: Conclusion103 Questions
Exam 23: Time-Series Analysis and Forecasting145 Questions
Exam 24: Index Numbers25 Questions
Exam 25: Decision Analysis51 Questions
Select questions type
If the coefficient of correlation is -0.7, then the percentage of the variation in y that is explained by the regression line is 70%.
(True/False)
4.9/5  (40)
(40)
A financier whose specialty is investing in movie productions has observed that, in general, movies with 'big-name' stars seem to generate more revenue than those movies whose stars are less well known. To examine his belief, he records the gross revenue and the payment (in $ million) given to the two highest-paid performers in the movie for 10 recently released movies. Movie Cost of two highest- paid performers (\ ) Gross revenue (\ ) 1 5.3 48 2 7.2 65 3 1.3 18 4 1.8 20 5 3.5 31 6 2.6 26 7 8.0 73 8 2.4 23 9 4.5 39 10 6.7 58 Determine the coefficient of determination, and discuss what its value tells you about the two variables.
(Essay)
4.9/5 (35)
The regression line  = 2 + 3x has been fitted to the data points (4,11), (2,7), and (1,5). The residual sum of squares will be 10.0.
(True/False)
4.9/5 (46)
The manager of a fast food restaurant wants to determine how sales in a given week are related to the number of discount vouchers (#) printed in the local newspaper during the week. The number of vouchers and sales ($000s) from 10 randomly selected weeks is given below with the predicted sales. 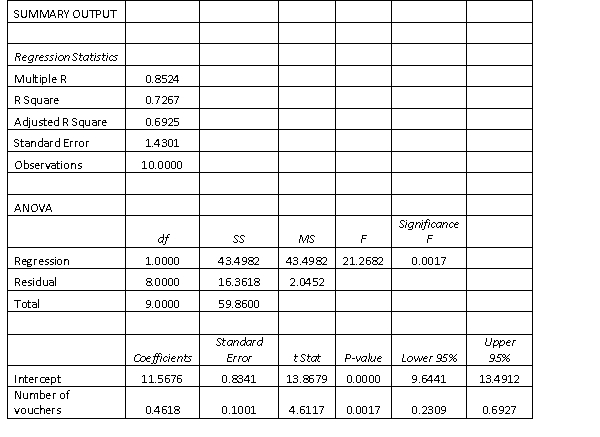 Compute the standardised residuals.
(Essay)
4.9/5 (34)
The vertical spread of the data points about the regression line is measured by the y-intercept.
(True/False)
4.8/5 (33)
If the coefficient of correlation is −0.50, the percentage of the variation in the dependent variable y that is explained by the variation in the independent variable x is:
(Multiple Choice)
4.8/5 (37)
In a simple linear regression model, if r2 is 0.75, then 75% of the variation in the dependent variable y can be explained by the regression line, on the independent variable x.
(True/False)
4.9/5 (33)
Which of the following statistics and procedures can be used to determine whether a linear model should be employed?
(Multiple Choice)
4.8/5 (40)
When the actual values y of a dependent variable and the corresponding predicted values  are the same, the standard error of the estimate will be 1.0.
(True/False)
4.8/5 (36)
Given a specific value of x and confidence level, which of the following statements is correct?
(Multiple Choice)
4.8/5 (30)
On the least squares regression line Estimated y= 2 - 3x, the predicted value of y equals:
(Multiple Choice)
4.9/5 (43)
The quality of oil is measured in API gravity degrees - the higher the degrees API, the higher the quality. The table shown below is produced by an expert in the field, who believes that there is a relationship between quality and price per barrel. Oil degrees API Price per barrel (in \ ) 27.0 12.02 28.5 12.04 30.8 12.32 31.3 12.27 31.9 12.49 34.5 12.70 34.0 12.80 34.7 13.00 37.0 13.00 41.0 13.17 41.0 13.19 38.8 13.22 39.3 13.27 A partial Minitab output follows.
Descriptive Statistics Variable Mean StDev SE Mean Degrees 13 34.60 4.613 1.280 Frice 13 12.730 0.457 0.127 Covariances Degrees Price Degrees 21.281667 Price 2.026750 0.208833 Regression Analysis Predictor Coef StDev Constant 9.4349 0.2867 32.91 0.000 Degrees 0.095235 0.008220 11.59 0.000 S = 0.1314 R-Sq = 92.46% R-Sq(adj) = 91.7%
Analysis of Variance Source DF SS MS F P Regression 1 2.3162 2.3162 134.24 0.000 Residual Error 11 0.1898 0.0173 Total 12 2.5060 Conduct a test of the population coefficient of correlation to determine at the 5% significance level whether a linear relationship exists between the quality of oil and price per barrel.
(Essay)
4.7/5 (38)
The residuals are observations of the error variable . Consequently, the minimised square of deviations is called the sum of squares for error, denoted SSE.
(True/False)
4.9/5 (25)
Filters
- Essay(0)
- Multiple Choice(0)
- Short Answer(0)
- True False(0)
- Matching(0)