Exam 18: Simple Linear Regression and Correlation
Exam 1: What Is Statistics14 Questions
Exam 2: Types of Data, Data Collection and Sampling16 Questions
Exam 3: Graphical Descriptive Methods Nominal Data19 Questions
Exam 4: Graphical Descriptive Techniques Numerical Data64 Questions
Exam 5: Numerical Descriptive Measures147 Questions
Exam 6: Probability106 Questions
Exam 7: Random Variables and Discrete Probability Distributions55 Questions
Exam 8: Continuous Probability Distributions117 Questions
Exam 9: Statistical Inference: Introduction8 Questions
Exam 10: Sampling Distributions65 Questions
Exam 11: Estimation: Describing a Single Population127 Questions
Exam 12: Estimation: Comparing Two Populations22 Questions
Exam 13: Hypothesis Testing: Describing a Single Population129 Questions
Exam 14: Hypothesis Testing: Comparing Two Populations78 Questions
Exam 15: Inference About Population Variances49 Questions
Exam 16: Analysis of Variance115 Questions
Exam 17: Additional Tests for Nominal Data: Chi-Squared Tests110 Questions
Exam 18: Simple Linear Regression and Correlation213 Questions
Exam 19: Multiple Regression121 Questions
Exam 20: Model Building92 Questions
Exam 21: Nonparametric Techniques126 Questions
Exam 22: Statistical Inference: Conclusion103 Questions
Exam 23: Time-Series Analysis and Forecasting145 Questions
Exam 24: Index Numbers25 Questions
Exam 25: Decision Analysis51 Questions
Select questions type
In testing the hypotheses: , the Spearman rank correlation coefficient in a sample of 50 observations is 0.389. The value of the test statistic is:
(Multiple Choice)
4.9/5  (36)
(36)
The Spearman rank correlation coefficient must be used to determine whether a relationship exists between two variables when:
(Multiple Choice)
4.8/5 (37)
The editor of a major academic book publisher claims that a large part of the cost of books is the cost of paper. This implies that larger books will cost more money. As an experiment to analyse the claim, a university student visits the bookstore and records the number of pages and the selling price of 12 randomly selected books. These data are listed below. Interpret the value of the slope of the regression line.
(Essay)
4.8/5 (33)
One method of diagnosing autocorrelation is to plot the residuals against the time periods to see whether some pattern emerges.
(True/False)
4.7/5 (33)
In a simple linear regression problem, the following statistics are calculated from a sample of 10 observations: = 2250, = 10, = 50, = 75 The least squares estimates of the slope and y-intercept are respectively:
(Multiple Choice)
4.8/5 (29)
Which of the following is not a required condition for the error variable in the simple linear regression model?
(Multiple Choice)
4.9/5 (42)
When the sample size n is greater than 30, the Spearman rank correlation coefficient is approximately normally distributed with:
(Multiple Choice)
4.8/5 (39)
A professor of economics wants to study the relationship between income y (in $1000s) and education x (in years). A random sample of eight individuals is taken and the results are shown below. Education 16 11 15 8 12 10 13 14 Income 58 40 55 35 43 41 52 49 Determine the least squares regression line.
(Essay)
4.8/5 (39)
When the actual values y of a dependent variable and the corresponding predicted values  are the same, the standard error of estimate, , will be -1.0.
(True/False)
4.8/5 (34)
In simple linear regression, the coefficient of correlation r and the least squares estimate of the population slope :
(Multiple Choice)
4.9/5 (29)
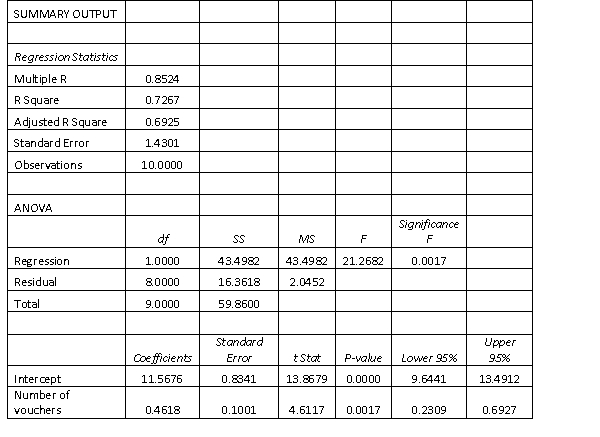
The manager of a fast food restaurant wants to determine how sales in a given week are related to the number of discount vouchers (#) printed in the local newspaper during the week. The number of vouchers and sales ($000s) from 10 randomly selected weeks is given below with Excel regression output. 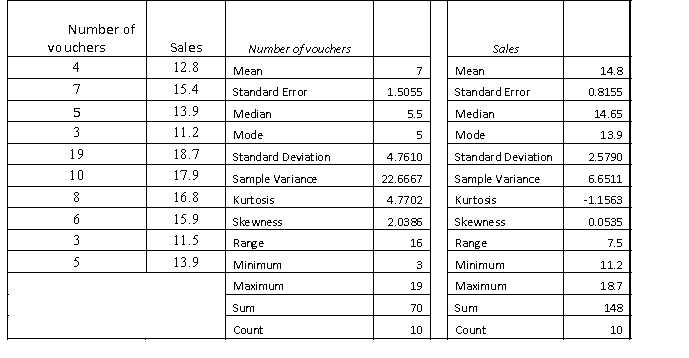
 Determine the standard error of the estimate and describe what this statistic sells you about the regression line.
(Essay)
4.8/5 (28)
The manager of a fast food restaurant wants to determine how sales in a given week are related to the number of discount vouchers (#) printed in the local newspaper during the week. The number of vouchers and sales ($000s) from 10 randomly selected weeks is given below with Excel regression output. 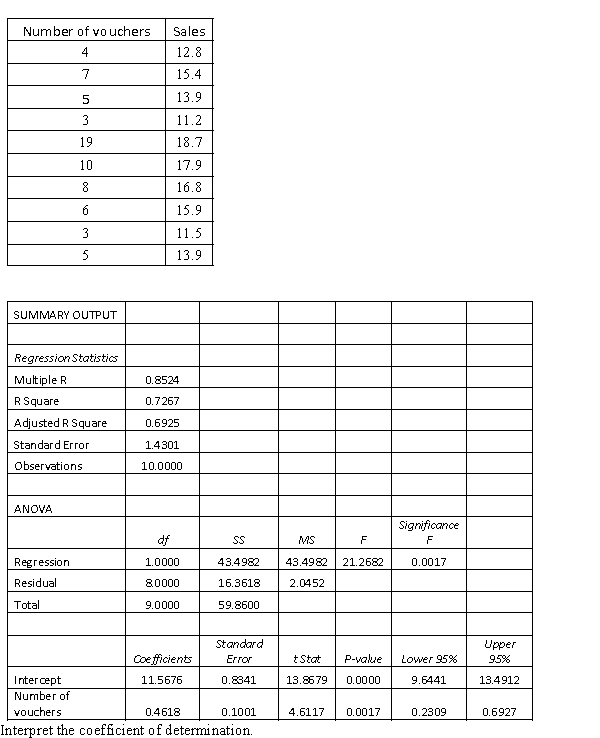
(Essay)
4.8/5 (32)
The coefficient of determination is the coefficient of correlation squared.
(True/False)
4.7/5 (31)
A professor of economics wants to study the relationship between income y (in $1000s) and education x (in years). A random sample of eight individuals is taken and the results are shown below. Education 16 11 15 8 12 10 13 14 Income 58 40 55 35 43 41 52 49 Predict with 95% confidence the income of an individual with 10 years of education.
(Essay)
4.9/5 (33)
The value of the sum of squares for regression, SSR, can never be smaller than 1.
(True/False)
4.8/5 (41)
Pop-up coffee vendors have been popular in the city of Adelaide in 2013. A vendor is interested in knowing how temperature (in degrees Celsius) impacts daily hot coffee sales revenue (in $00's).
A random sample of 6 days was taken, with the daily hot coffee sales revenue and the corresponding temperature of that day noted. Excel output given below. Coffee sales revenue Temperature 6.50 25 10.00 17 5.50 30 4.50 35 3.50 40 28.00 9 Test the hypothesis that the population intercept is positive, at the 5% level of significance.
(Essay)
4.9/5 (41)
A statistician investigating the relationship between the amount of precipitation (in inches) and the number of car accidents gathered data for 10 randomly selected days. The results are presented below. Day Precipitation Number of accidents 1 0.05 5 2 0.12 6 3 0.05 2 4 0.08 4 5 0.10 8 6 0.35 14 7 0.15 7 8 0.30 13 9 0.10 7 10 0.20 10 Calculate the Spearman rank correlation coefficient, and test to determine at the 5% significance level whether we can infer that a linear relationship exists between the number of accidents and the amount of precipitation.
(Essay)
4.9/5 (29)
Which value of the coefficient of correlation r indicates a stronger correlation than − 0.85?
(Multiple Choice)
4.7/5 (35)
When all the actual values of y and the predicted values of y are equal, the standard error of estimate will be:
(Multiple Choice)
5.0/5 (42)
Filters
- Essay(0)
- Multiple Choice(0)
- Short Answer(0)
- True False(0)
- Matching(0)